 Leif160519的blog
——————
构建狂拽炫酷屌的 MySQL 监控平台
首先,简单介绍下prometheus+grafana 这对鸳鸯到底是什么:
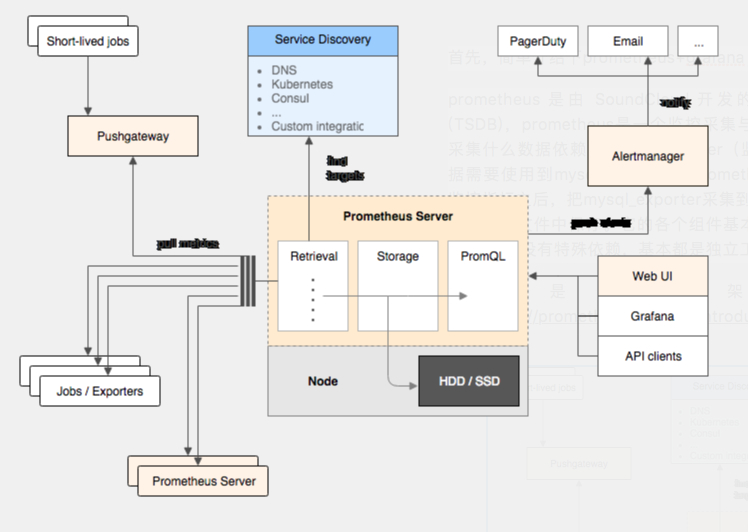
prometheus 是由 SoundCloud 开发的开源监控报警系统和时序列数据库(TSDB),prometheus是一个监控采集与数据存储框架(监控server端),具体采集什么数据依赖于具体的exporter(监控client端),例如:采集MySQL的数据需要使用到mysql_exporter,prometheus调用mysql_expoter采集到mysql的监控指标之后,把mysql_exporter采集到的数据存放到prometheus所在服务器的磁盘数据文件中保存。它的各个组件基本都是用 golang 编写,对编译和部署十分友好.并且没有特殊依赖,基本都是独立工作。
以下是prometheus架构图,图片来源:https://prometheus.io/docs/introduction/overview/
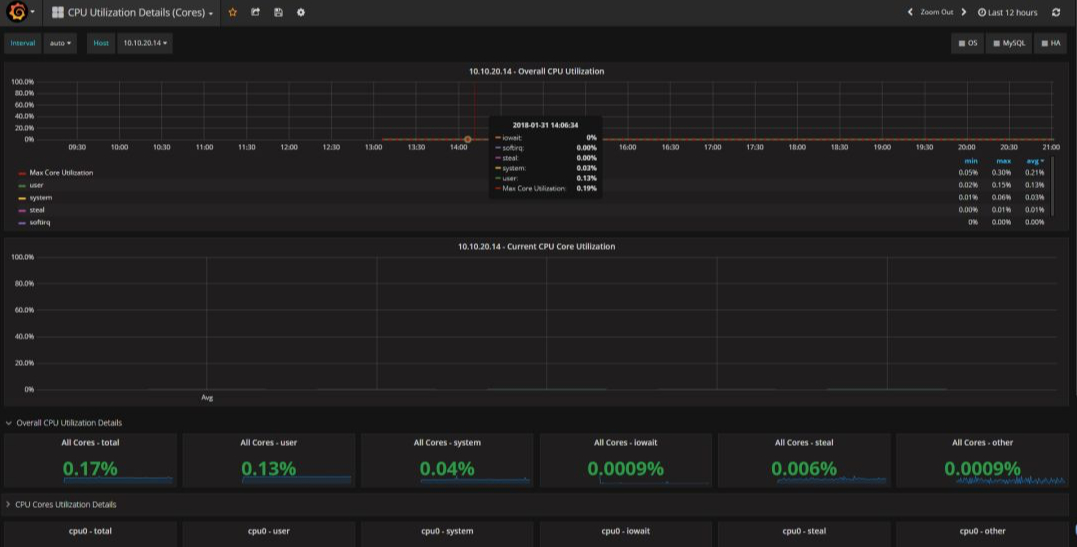
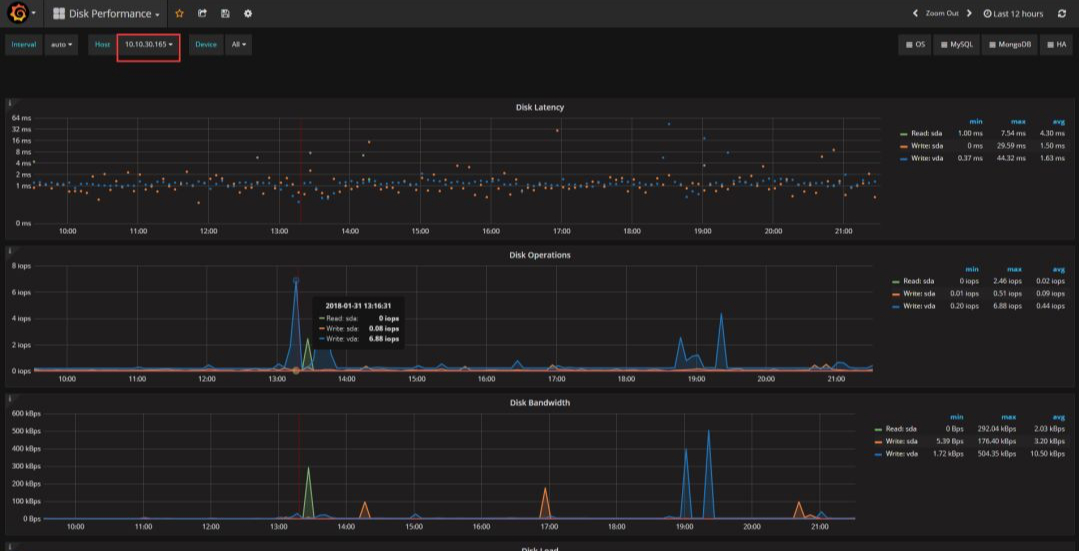
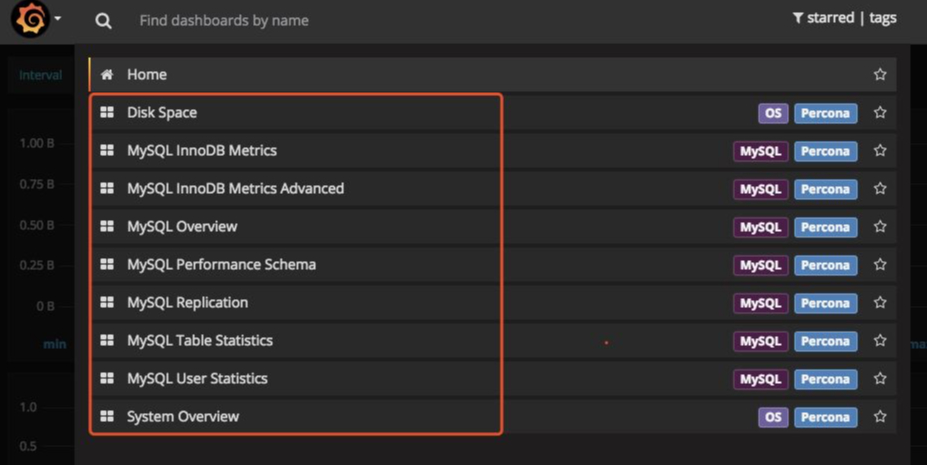
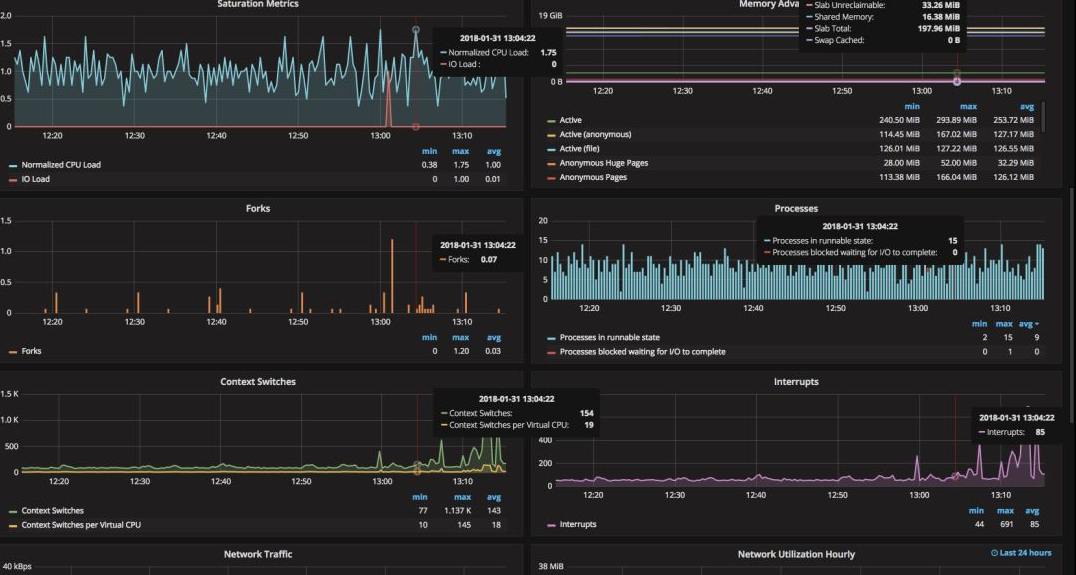
grafana是一个高颜值的监控绘图程序,也是一个可视化面板(Dashboard),grafana的厉害之处除了高颜值,还支持多种数据源(支持Graphite、zabbix、InfluxDB、Prometheus和OpenTSDB作为数据源)、支持灵活丰富的dashboard配置选项(例如:可以把多个实例的相同采集项配置在一个展示框里),使得相较于其他开源监控系统来说更易用性,学习成本更低。从视觉上来说,比以往的任何开源的监控系统都看起来要养眼很多,下面先看两张监控效果图:
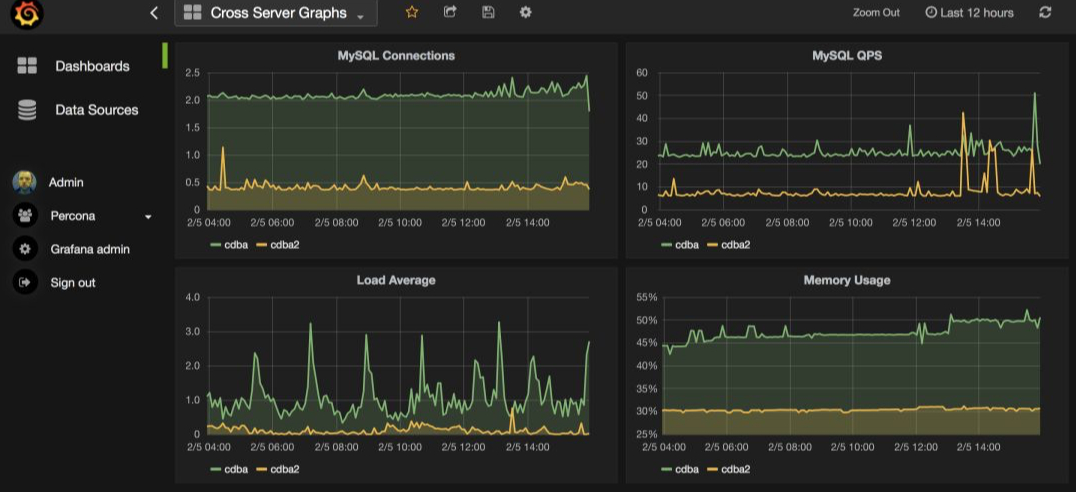
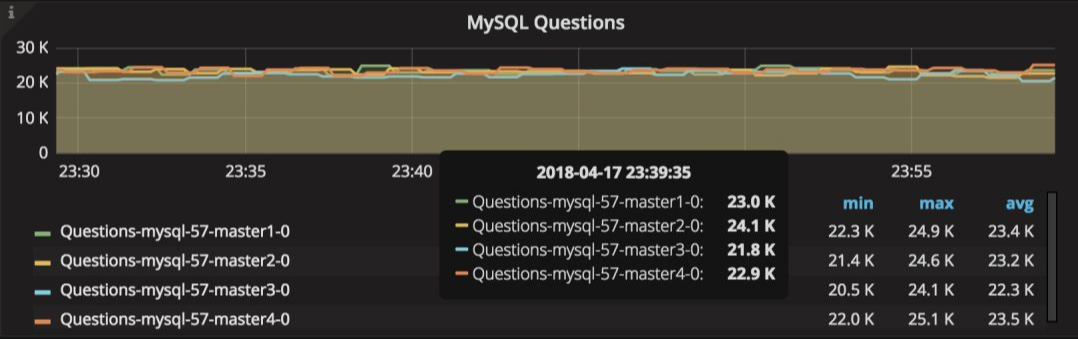
相信审美还算正常的人都不会说上面两张图很丑吧,那么问题来了,我们该如何玩起来呢?下面就简单为大家介绍如何快速搭建起来!
这里方便演示过程,我们准备了如下两台测试服务器
-
prometheus+grafana server端主机:10.10.30.165
-
MySQL 客户端主机:10.10.20.14
1、安装prometheus
1.1. 下载安装包
对于prometheus,假设我们需要监控MySQL,那么我们需要下载至少3个组件,如下:
- prometheus程序包
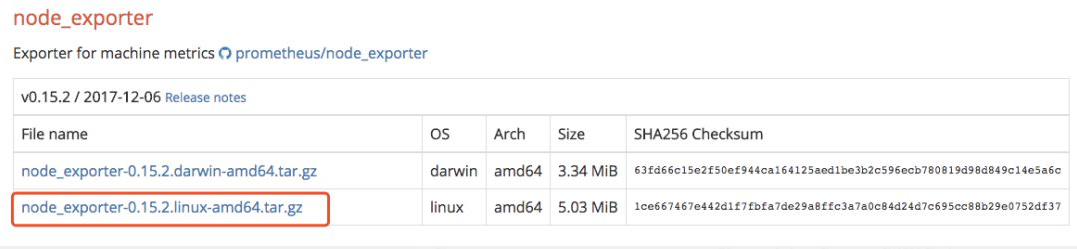
- node_exporter:监控主机磁盘、内存、CPU等硬件性能指标的采集程序包
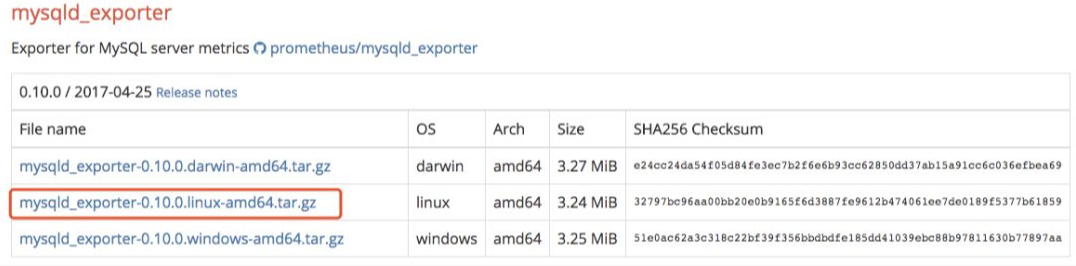
- mysql_exporter: 监控mysql各种性能指标的采集程序包
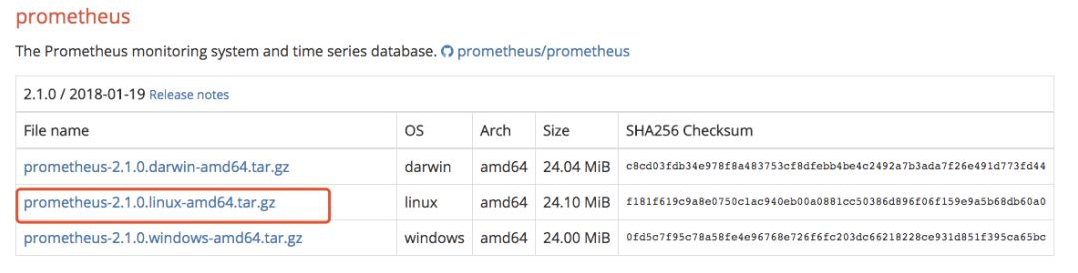
下载链接(该页面始终只有一个最新版本):https://prometheus.io/download/
下载prometheus
下载node_exporter
下载mysqld_exporter
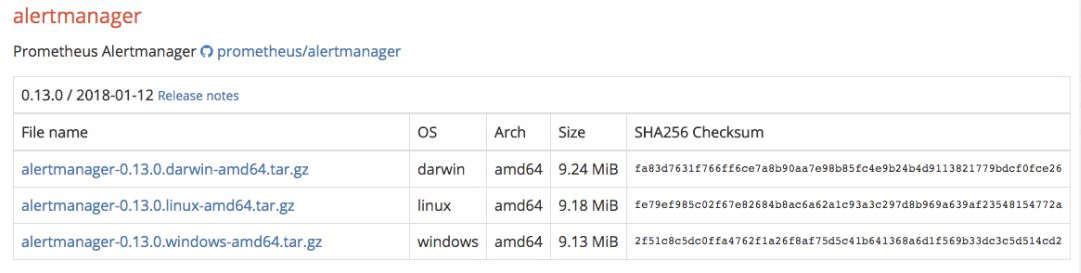
PS:如果你还需要配置监控告警,需要下载alertmanager程序包
1.2. 解压程序包
解压prometheus
[root@localhost ~]# mkdir /data
[root@localhost ~]# tar xvf prometheus-2.1.0.linux-amd64.tar.gz -C /data/
解压exporter
由于prometheus主机自身也需要监控,所以也至少需要解压node_exporter包
[root@localhost ~]# tar xf node_exporter-0.15.2.linux-amd64.tar -C /root/
# 如果需要监控mysql,则继续解压mysql_exporter
[root@localhost ~]# tar xf mysqld_exporter-0.10.0.linux-amd64.tar  -C /root/
1.3. 启动prometheus
进入prometheus的工作目录
[root@localhost ~]# cd /data/
[root@localhost data]# mv prometheus-2.1.0.linux-amd64/ prometheus
[root@localhost ~]# cd /data/prometheus
配置 prometheus.yml配置文件
[root@localhost data]# cat prometheus.yml
# my global config
global:
  scrape_interval:    15s # Set the scrape interval to every 15 seconds. Default is every 1 minute.
  evaluation_interval: 15s # Evaluate rules every 15 seconds. The default is every 1 minute.
  # scrape_timeout is set to the global default (10s).
# A scrape configuration containing exactly one endpoint to scrape:
# Here it's Prometheus itself.
scrape_configs:
- file_sd_configs:
  - files:
    - host.yml
  job_name: Host
  metrics_path: /metrics
  relabel_configs:
  - source_labels: [__address__]
    regex: (.*)
    target_label: instance
    replacement: $1
  - source_labels: [__address__]
    regex: (.*)
    target_label: __address__
    replacement: $1:9100
- file_sd_configs:
  - files:
    - mysql.yml
  job_name: MySQL
  metrics_path: /metrics
  relabel_configs:
  - source_labels: [__address__]
    regex: (.*)
    target_label: instance
    replacement: $1
  - source_labels: [__address__]
    regex: (.*)
    target_label: __address__
    replacement: $1:9104


- job_name: prometheus
  static_configs:
  - targets:
    - localhost:9090
启动prometheus进程
30d表示prometheus只保留30天以内的数据
[root@localhost prometheus]# /data/prometheus/prometheus --storage.tsdb.retention=30d &
如果是7.x系统,可以按照如下方式配置service启动脚本
# 修改WorkingDirectory参数为你的prometheus的工作目录
[root@localhost prometheus]# cat /usr/lib/systemd/system/prometheus.service
[Unit]
Description=Prometheus instance
Wants=network-online.target
After=network-online.target
After=postgresql.service mariadb.service mysql.service


[Service]
User=root
Group=root
Type=simple
Restart=on-failure
WorkingDirectory=/data/prometheus/
RuntimeDirectory=prometheus
RuntimeDirectoryMode=0750
ExecStart=/data/prometheus/prometheus  --storage.tsdb.retention=30d --config.file=/data/prometheus/prometheus.yml
LimitNOFILE=10000
TimeoutStopSec=20


[Install]
WantedBy=multi-user.target
PS:prometheus默认的web访问端口为9090,可以使用如下地址访问http://10.10.30.165:9090
2、安装grafana
前面说过,grafana是一个出图展示框架,grafana根据grafana-dashboards来进行展示,grafana-dashboards就类似于grafana的出图配置文件,根据在grafana-dashboards中的定义来确定在页面中需要展示什么指标,需要如何展示等,需要分别对这两个组件进行下载与安装
2.1. 下载安装包
对于grafana来说,需要下载一个程序包,一个grafana-dashboards包
下载链接
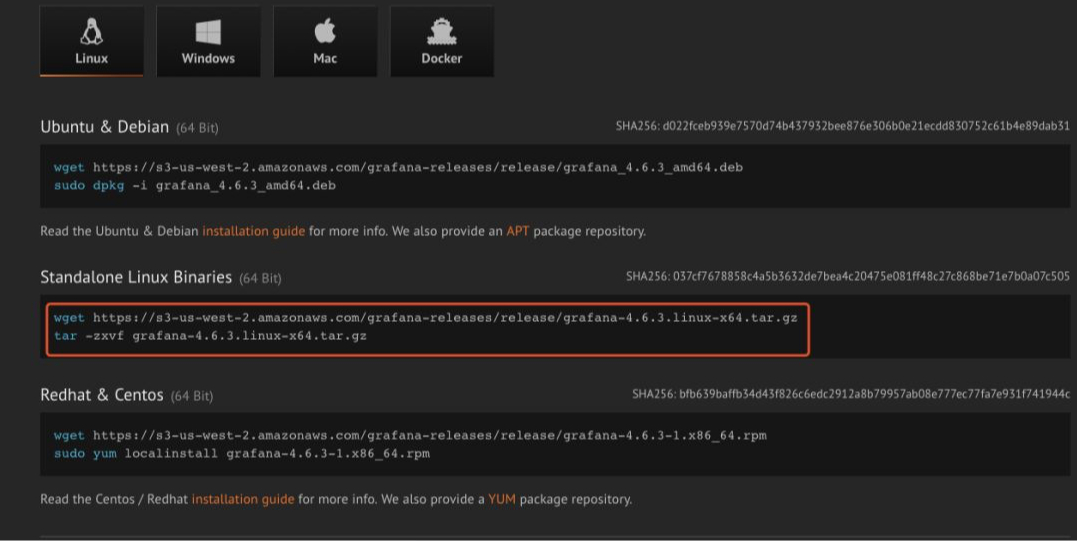
grafana程序包:https://grafana.com/grafana/download
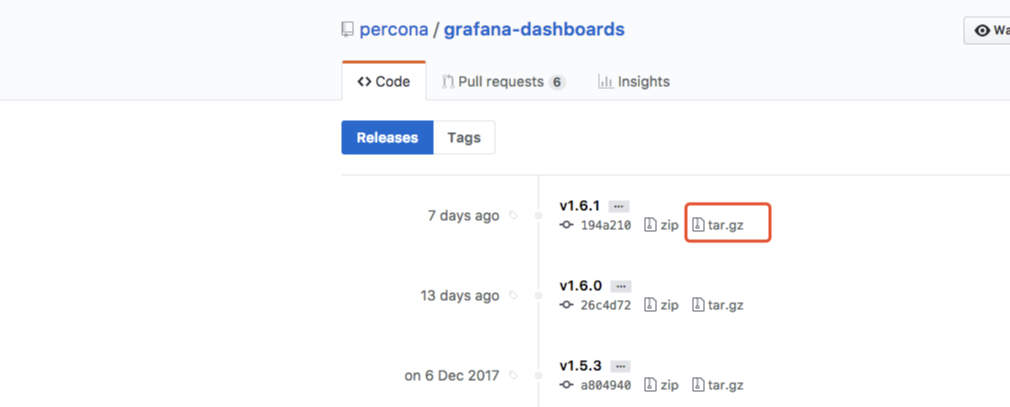
grafana-dashboards包:https://github.com/percona/grafana-dashboards/releases
2.2. 解压程序包
解压grafana
[root@localhost ~]# tar xf grafana-4.6.3.linux-x64.tar.gz -C /data/prometheus/
[root@localhost ~]# cd /data/prometheus
[root@localhost prometheus]# mv grafana-4.6.3/ grafana
2.3. 启动grafana
进入grafana工作目录,并启动
[root@localhost ]# cd /data/prometheus/grafana
[root@localhost ]# ./bin/grafana-server
如果是7.x系统,可以按照如下方式配置service启动脚本
[root@localhost service]# cat /usr/lib/systemd/system/grafana-server.service
[Unit]
Description=Grafana instance
Documentation=http://docs.grafana.org
Wants=network-online.target
After=network-online.target
After=postgresql.service mariadb.service mysql.service
[Service]
User=root
Group=root
Type=simple
Restart=on-failure
WorkingDirectory=/data/prometheus/grafana
RuntimeDirectory=grafana
RuntimeDirectoryMode=0750
ExecStart=/data/prometheus/grafana/bin/grafana-server
LimitNOFILE=10000
TimeoutStopSec=20
[Install]
WantedBy=multi-user.target
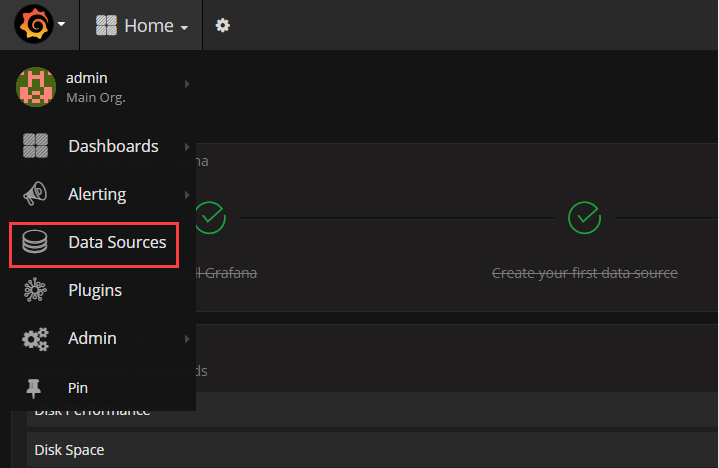
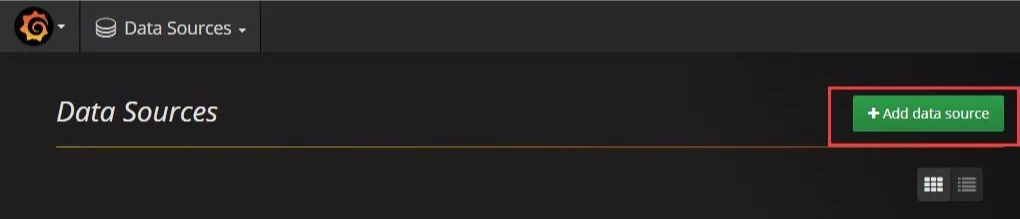
打开grafana页面
(默认帐号和密码:admin/admin,默认的端口为3000,通过地址:http://10.10.30.165:3000 访问),配置数据来源
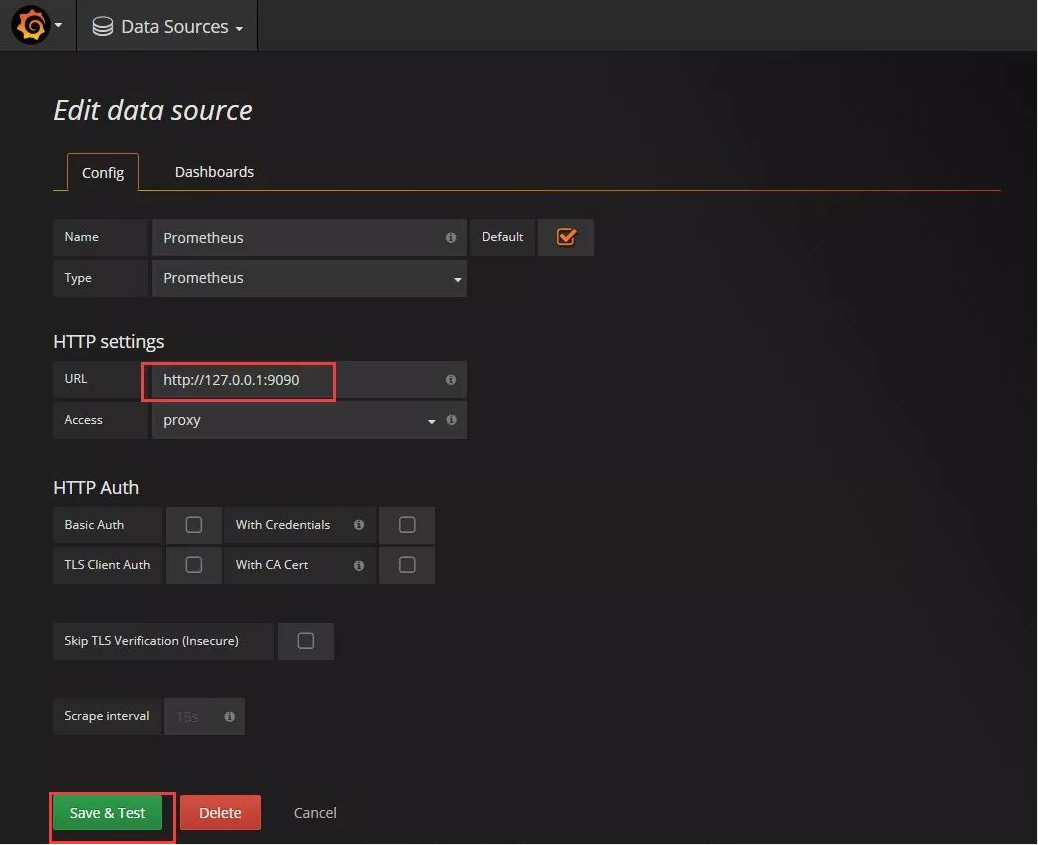
指定prometheus地址
这里我们把grafana装在了同一台机器,直接使用127.0.0.1的地址配置即可,如下图
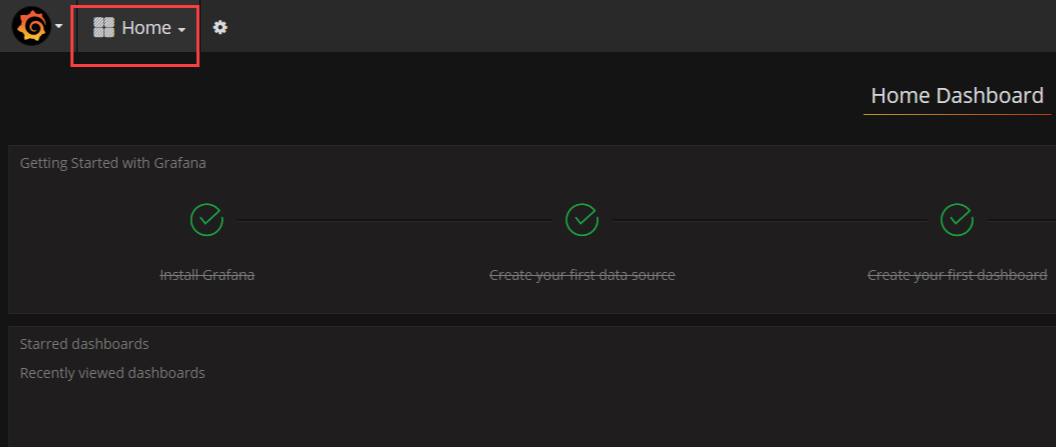
2.4. 在grafana中导入grafana-dashboards
解压grafana-dashboards包
该包中提供了大量的json格式文件的grafana dashboards,根据需要自行选择,我们这里需要监控主机和MySQL,就选择如下一些json文件
[root@localhost ~]# tar xvf grafana-dashboards-1.6.1.tar.gz
[root@localhost ~]# cd grafana-dashboards-1.6.1
[root@localhost grafana-dashboards-1.6.1]# updatedb
[root@localhost grafana-dashboards-1.6.1]# locate json |grep dashboards/
 ............
/root/grafana-dashboards-1.6.1/dashboards/CPU_Utilization_Details_Cores.json
/root/grafana-dashboards-1.6.1/dashboards/Disk_Performance.json
/root/grafana-dashboards-1.6.1/dashboards/Disk_Space.json
 ............
/root/grafana-dashboards-1.6.1/dashboards/MySQL_InnoDB_Metrics.json
/root/grafana-dashboards-1.6.1/dashboards/MySQL_InnoDB_Metrics_Advanced.json
 ............
 /root/grafana-dashboards-1.6.1/dashboards/MySQL_Overview.json
 /root/grafana-dashboards-1.6.1/dashboards/MySQL_Performance_Schema.json
 ............
/root/grafana-dashboards-1.6.1/dashboards/MySQL_Replication.json
/root/grafana-dashboards-1.6.1/dashboards/MySQL_Table_Statistics.json
 ............
/root/grafana-dashboards-1.6.1/dashboards/Summary_Dashboard.json
/root/grafana-dashboards-1.6.1/dashboards/System_Overview.json
 ............
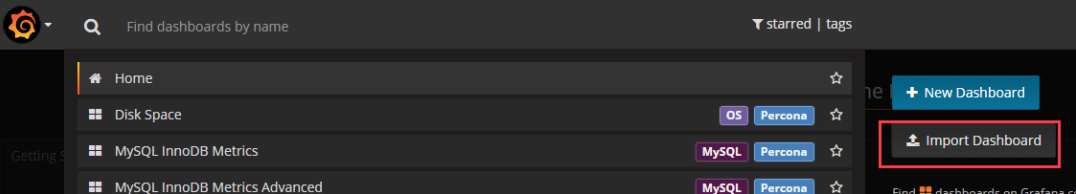
在grafana页面中,导入需要的json文件
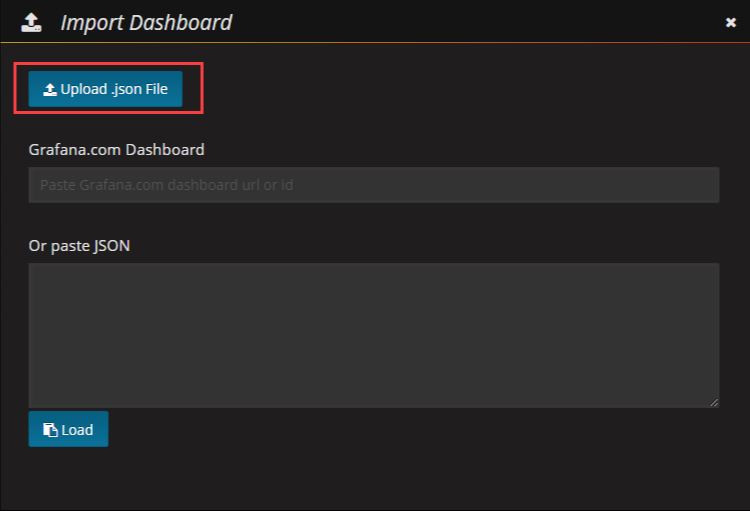
在弹出的窗口中选择你需要导入的json文件
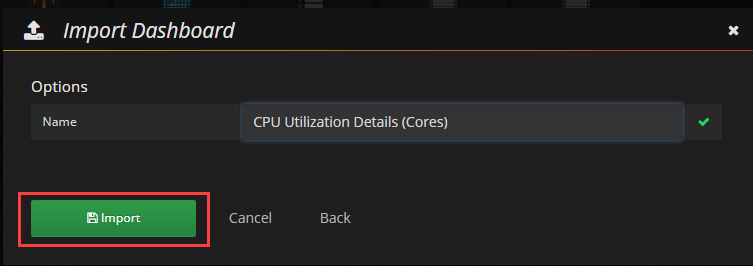
然后,如果你的grafana中已经添加过主机,此时,就可以看到相应的json dashboard监控数据
至此,prometheus+grafana的基础架构(server端)已经搭建好了,现在,你可以去给他们添加监控节点了(client端)
3、监控节点部署
3.1. 添加主机监控
以添加prometheus主机(10.10.30.165)为例进行说明
解压exporter压缩包
[root@localhost ~]# tar xf node_exporter-0.15.2.linux-amd64.tar
[root@localhost ~]# mv node_exporter-0.15.2.linux-amd64 node_exporter
启动node_exporter程序
[root@localhost ~]# cd node_exporter
[root@localhost node_exporter]# nohup ./node_exporter &
配置prometheus主机监控配置列表文件
由于之前主配置文件prometheus.yml 中已经定义了监控主机的配置文件host.yml,这里只需要把主机IP信息填入即可动态生效
[root@localhost node_exporter]# cat /data/prometheus/host.yml
- labels:
    service: test
  targets:
  - 10.10.30.165
然后,在grafana页面中就可以看到你配置的主机
PS:如果该文件中已经配置过lables且不需要使用独立的service标签进行标记,则新添加的实例的IP可以直接放在同一个targets下,如下
[root@localhost mysqld_exporter]# cat /data/prometheus/host.yml
- labels:
    service: test
  targets:
  - 10.10.30.165
  - 10.10.20.14
3.2. 添加MySQL监控
添加MySQL监控主机,这里以添加10.10.20.14为例进行说明
解压exporter压缩包
[root@localhost ~]# tar xf mysqld_exporter-0.10.0.linux-amd64.tar
[root@localhost ~]# mv mysqld_exporter-0.10.0.linux-amd64 mysqld_exporter
配置监控数据库需要的主机IP、数据库端口、数据库账号和密码的环境变量
(注意:该账号需要单独创建,需要对所有库所有表至少具有PROCESS, REPLICATION CLIENT, SELECT权限)
[root@luoxiaobo-01 ~]# export DATA_SOURCE_NAME='admin:password@(10.10.20.14:3306)/'
[root@luoxiaobo-01 ~]# echo "export DATA_SOURCE_NAME='admin:password@(10.10.20.14:3306)/'" >> /etc/profile
启动exporter
# 由于目前最新的版本默认关闭了大量的mysql采集项,需要显式使用相应的选项开启(截止到写稿时间,最新的开发版本可以通过prometheus端的配置项让exporter端生效,而无需再exporter中使用大量的启动选项开启)
[root@localhost ~]# cd mysqld_exporter
[root@localhost mysqld_exporter]# nohup ./mysqld_exporter --collect.info_schema.processlist --collect.info_schema.innodb_tablespaces --collect.info_schema.innodb_metrics  --collect.perf_schema.tableiowaits --collect.perf_schema.indexiowaits --collect.perf_schema.tablelocks --collect.engine_innodb_status --collect.perf_schema.file_events --collect.info_schema.processlist --collect.binlog_size --collect.info_schema.clientstats --collect.perf_schema.eventswaits &
配置prometheus MySQL监控配置列表文件
由于之前主配置文件prometheus.yml 中已经定义了监控主机的配置文件mysql.yml,这里只需要把主机IP信息填入即可动态生效
[root@localhost mysqld_exporter]# cat /data/prometheus/host.yml
- labels:
    service: test
  targets:
  - 10.10.30.165
  - 10.10.20.14
然后,在grafana页面中就可以看到你配置的MySQL实例
PS:如果该文件中已经配置过lables且不需要使用独立的service标签进行标记,则新添加的实例的IP可以直接放在同一个targets下,如下
[root@localhost mysqld_exporter]# cat /data/prometheus/mysql.yml

- labels:
    service: test
  targets:
  - 10.10.30.165
  - 10.10.20.14
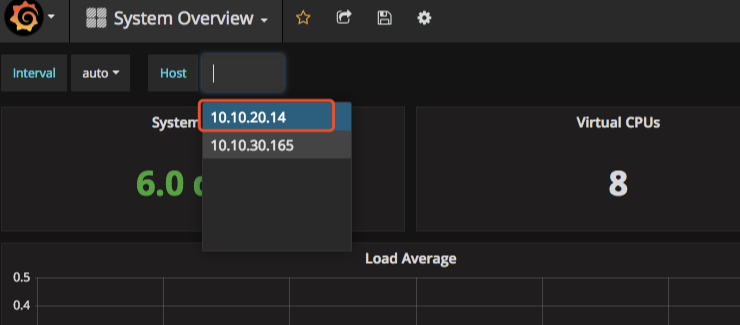
3.3. grafana页面dashboard切换
根据需要切换监控模板
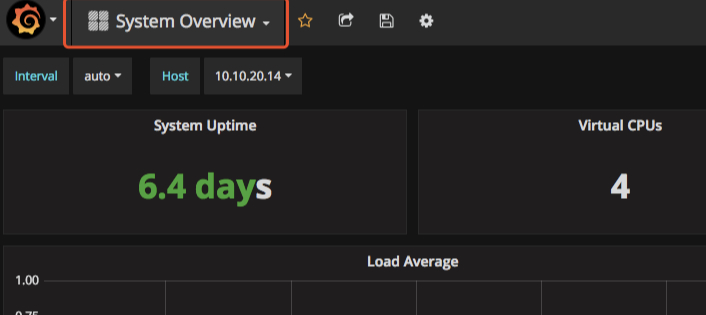
然后,就能看到你想要的数据
到这里,本文也接近尾声了,相信大家按照本文介绍的步骤操作一翻,已经一睹了grafana炫酷界面的芳容了!
“The first 90% of the code accounts for the first 90% of the development time. The remaining 10% of the code accounts for the other 90% of the development time.” – Tom Cargill
标 题:构建狂拽炫酷屌的 MySQL 监控平台作 者:Leif160519
出 处:https://github.icu/articles/2019/10/08/1570537146595.html
关于博主:坐标六朝古都南京,服务器运维工程师+桌面运维工程师,如有问题探讨可以直接下方留言。
声援博主:如果您觉得文章对您有帮助,可以评论、订阅、收藏。您的鼓励是博主的最大动力!
- 1、安装prometheus
- 1.1. 下载安装包
- 下载prometheus
- 下载node_exporter
- 下载mysqld_exporter
- 1.2. 解压程序包
- 解压prometheus
- 解压exporter
- 1.3. 启动prometheus
- 进入prometheus的工作目录
- 配置 prometheus.yml配置文件
- 启动prometheus进程
- 如果是7.x系统,可以按照如下方式配置service启动脚本
- 2、安装grafana
- 2.1. 下载安装包
- 2.2. 解压程序包
- 解压grafana
- 2.3. 启动grafana
- 进入grafana工作目录,并启动
- 如果是7.x系统,可以按照如下方式配置service启动脚本
- 打开grafana页面
- 指定prometheus地址
- 2.4. 在grafana中导入grafana-dashboards
- 解压grafana-dashboards包
- 在grafana页面中,导入需要的json文件
- 在弹出的窗口中选择你需要导入的json文件
- 然后,如果你的grafana中已经添加过主机,此时,就可以看到相应的json dashboard监控数据
- 3、监控节点部署
- 3.1. 添加主机监控
- 解压exporter压缩包
- 启动node_exporter程序
- 配置prometheus主机监控配置列表文件
- 然后,在grafana页面中就可以看到你配置的主机
- 3.2. 添加MySQL监控
- 解压exporter压缩包
- 配置监控数据库需要的主机IP、数据库端口、数据库账号和密码的环境变量
- 启动exporter
- 配置prometheus MySQL监控配置列表文件
- 然后,在grafana页面中就可以看到你配置的MySQL实例
- 3.3. grafana页面dashboard切换
- 根据需要切换监控模板
- 然后,就能看到你想要的数据