 Leif160519的blog
——————
目录
zabbix 4.4.7 监控Windows
zabbix 4.4.7 监控Windows

1.下载zabbix agents Windows版本
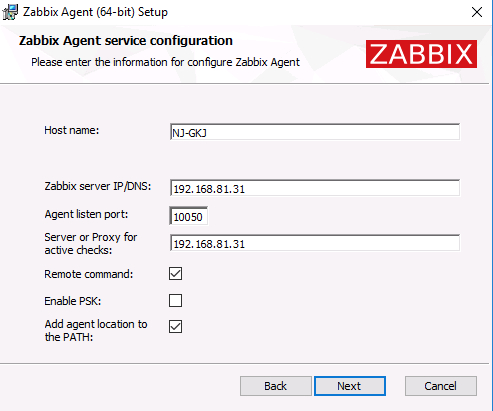
2. 安装
填写zabbix-server地址,之后无脑下一步即可。
安装完成之后会在服务中创建一个zabbix agent服务

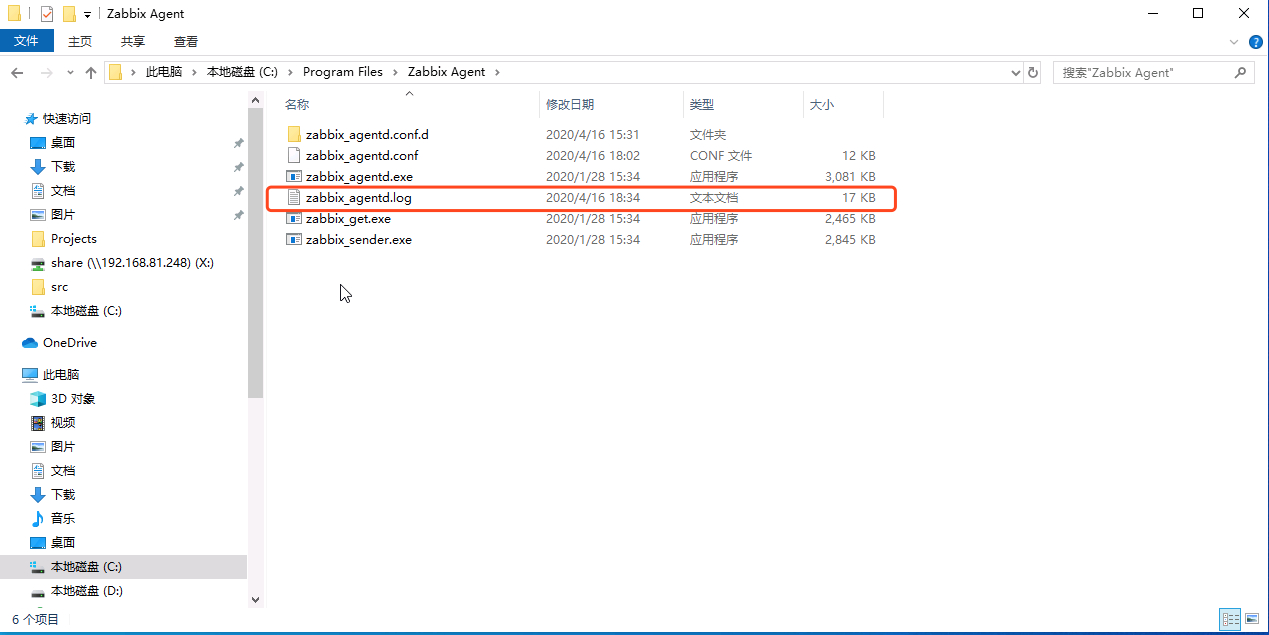
目录结构:

agent安装与卸载(注意得以管理员运行终端)
cmd /c "C:\Program Files\Zabbix Agent\zabbix_agentd.exe -c zabbix_agentd.conf -i"
cmd /c "C:\Program Files\Zabbix Agent\zabbix_agentd.exe -c zabbix_agentd.conf -s"
cmd /c "C:\Program Files\Zabbix Agent\zabbix_agentd.exe -c zabbix_agentd.conf -x"
cmd /c "C:\Program Files\Zabbix Agent\zabbix_agentd.exe -c zabbix_agentd.conf -d"
参数解释:
- -c :指定配置文件所有位置
- -i :安装客户端
- -s :启动客户端
- -x :停止客户端
- -d :卸载客户端
查看Windows端口使用
C:\Users\Administrator>netstat -ano|findstr "10050"
  TCP    0.0.0.0:10050          0.0.0.0:0              LISTENING       8980
  TCP    [::]:10050             [::]:0                 LISTENING       8980
启动成功后生成一个记录日志
2.获取Windows的监控指标和计数器
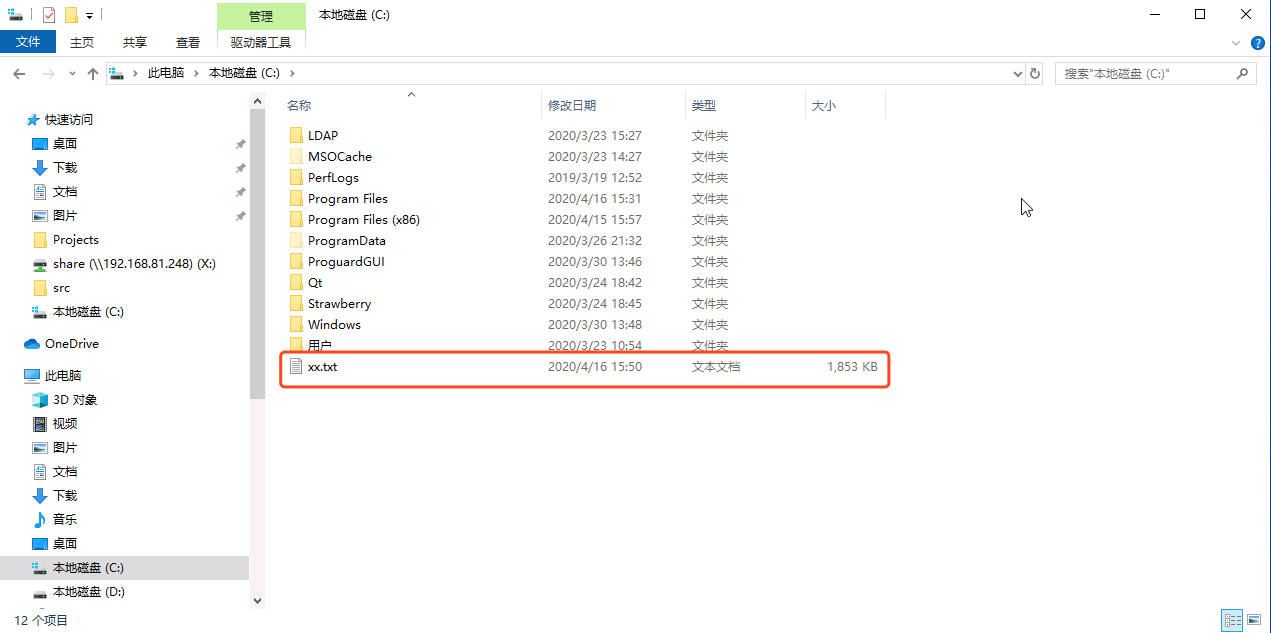
typeperf -qx > c:\xx.txt
生成一个xx.txt文件
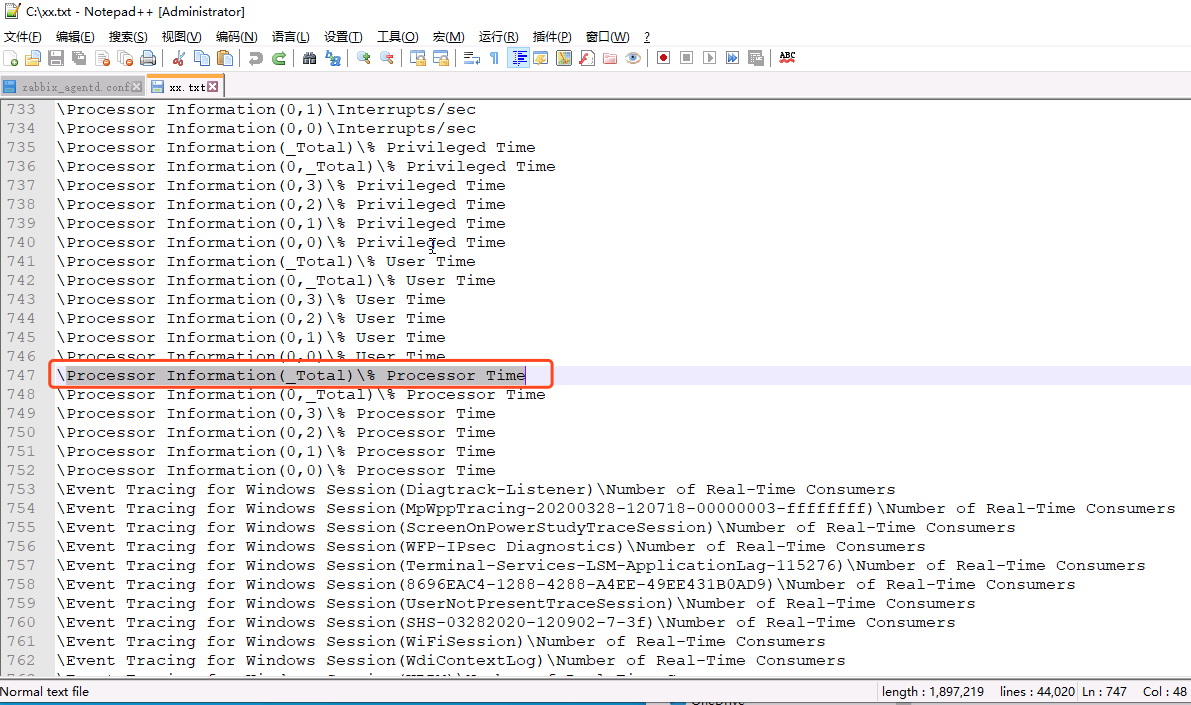
查找自己想要监控的信息
3.配置agent
在zabbix_agentd.conf配置文件最后添加如下内容:
PerfCounter = UserPerfCountercpu,"\Processor Information(_Total)\% Processor Time",3
PerfCounter = UserPerfCountercpuUserTime,"\Processor Information(_Total)\% User Time",3

PerfCounter = UserPerfCounterFileSystemBytesWritten,"\FileSystem Disk Activity(_Total)\FileSystem Bytes Written",3
PerfCounter = UserPerfCounterFileSystemBytesRead,"\FileSystem Disk Activity(_Total)\FileSystem Bytes Read",3

PerfCounter = UserPerfCounterNetworkCurrentBandwidth,"\Network Interface(Intel[R] 82574L Gigabit Network Connection)\Current Bandwidth",3

说明:
-
PerfCounter:固定写法 -
UserPerfCountercpu:自定义名称 -
"Processor Information(_Total)\% Processor Time":监控项 -
3:时间秒
去服务中重启zabbix客户端
4.创建主机,查看监控效果
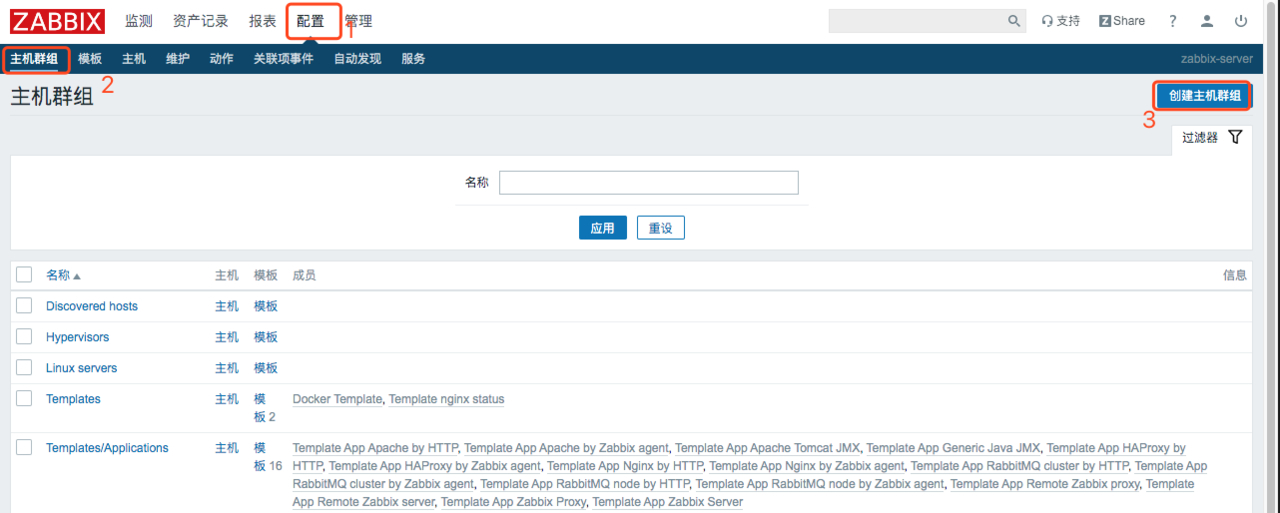
4.1 新建一个名为Windows的主机群组
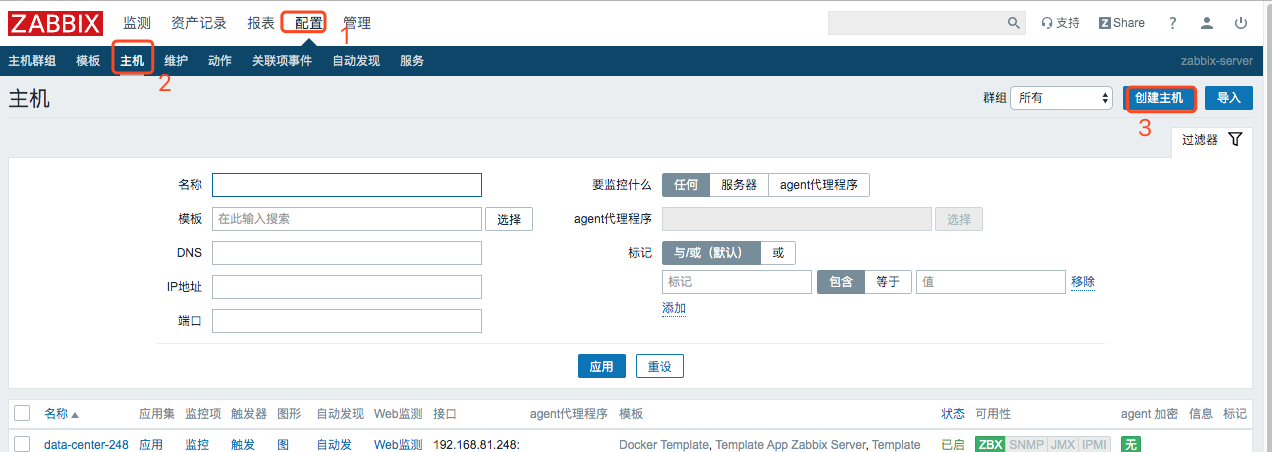
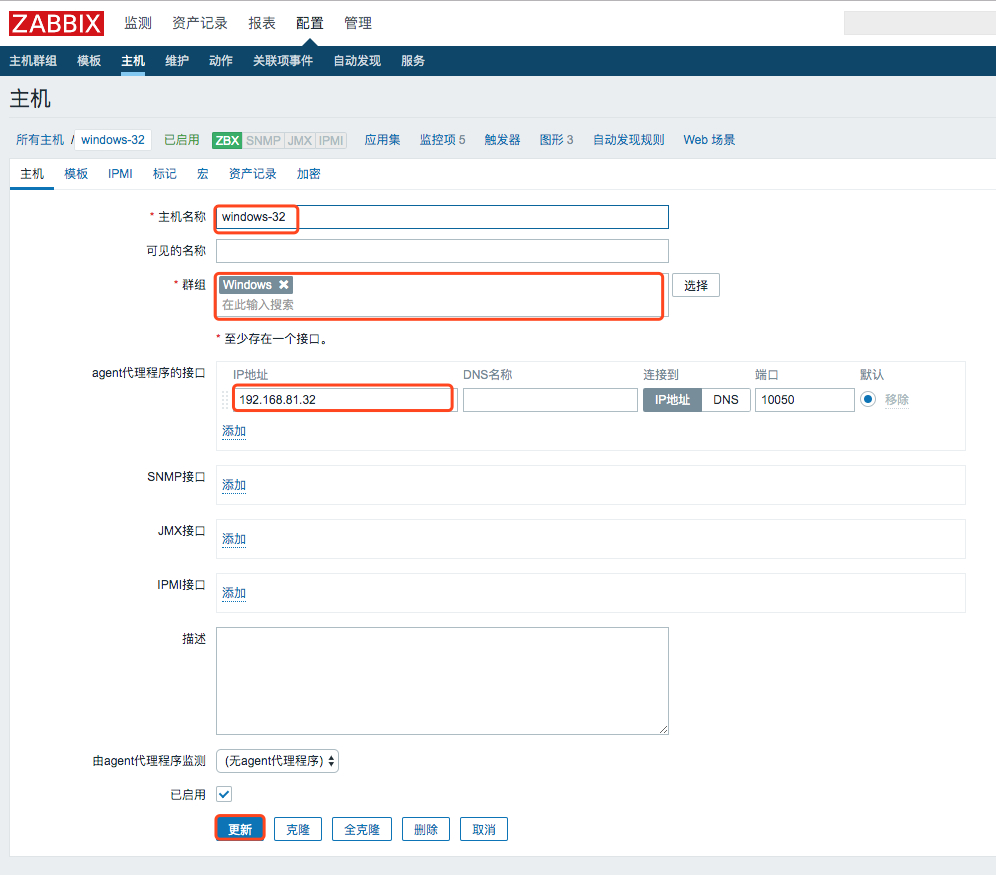
4.2 创建主机
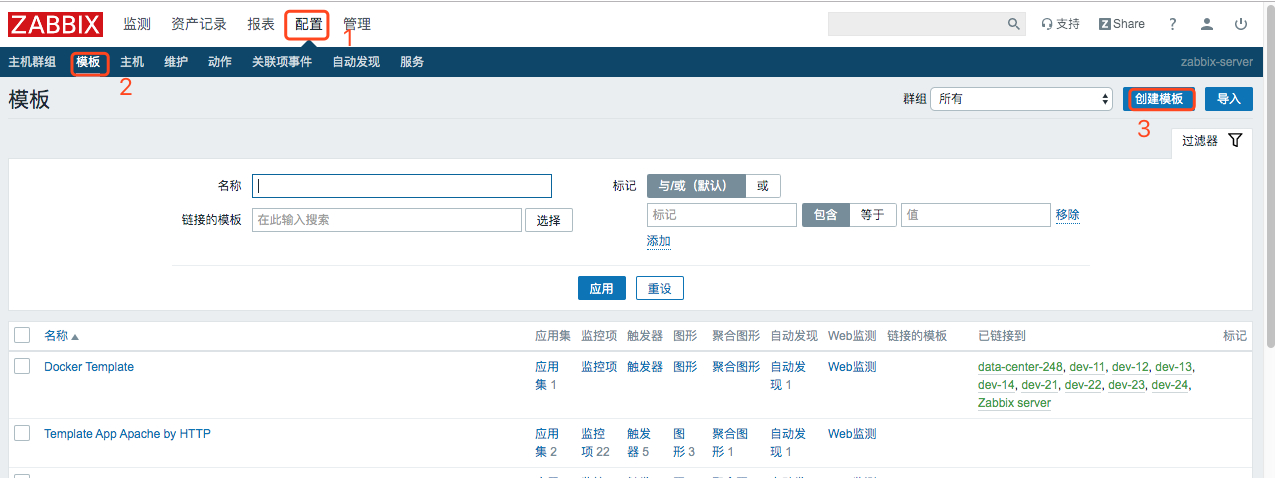
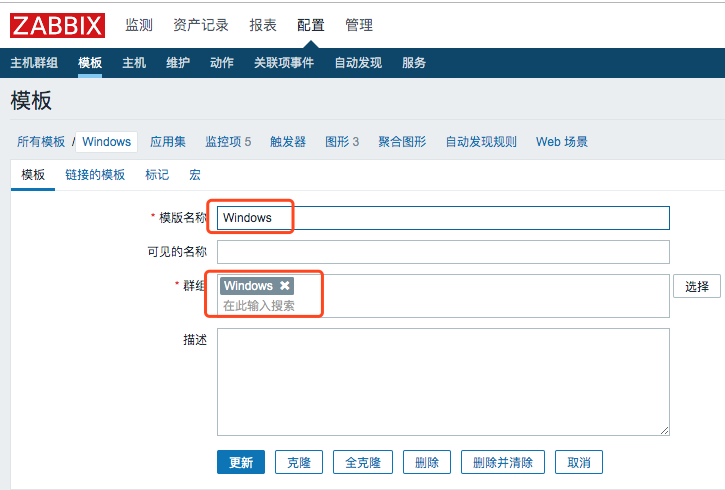
4.3 新建模板
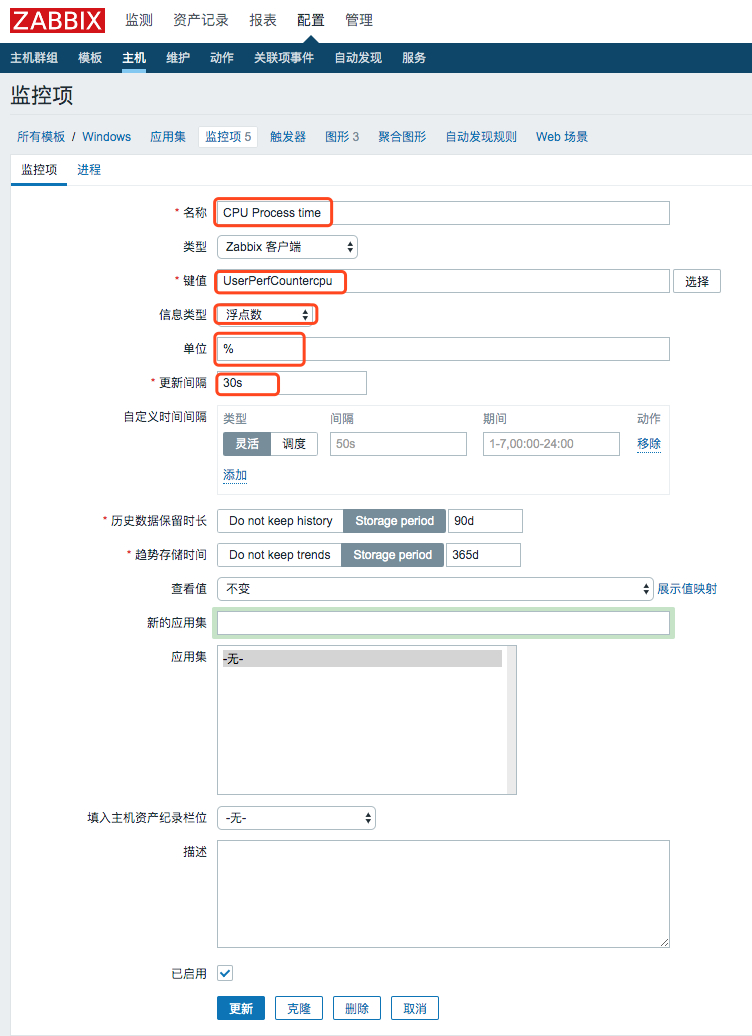
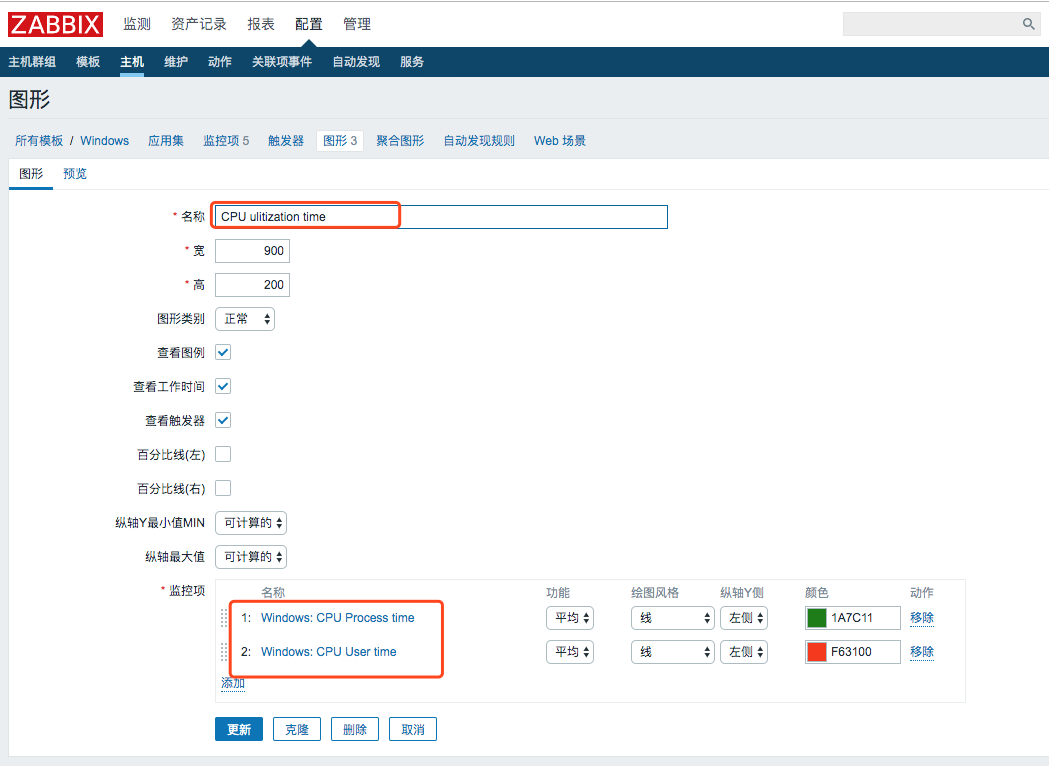
4.4 建立图形显示,添加上述两个监控项
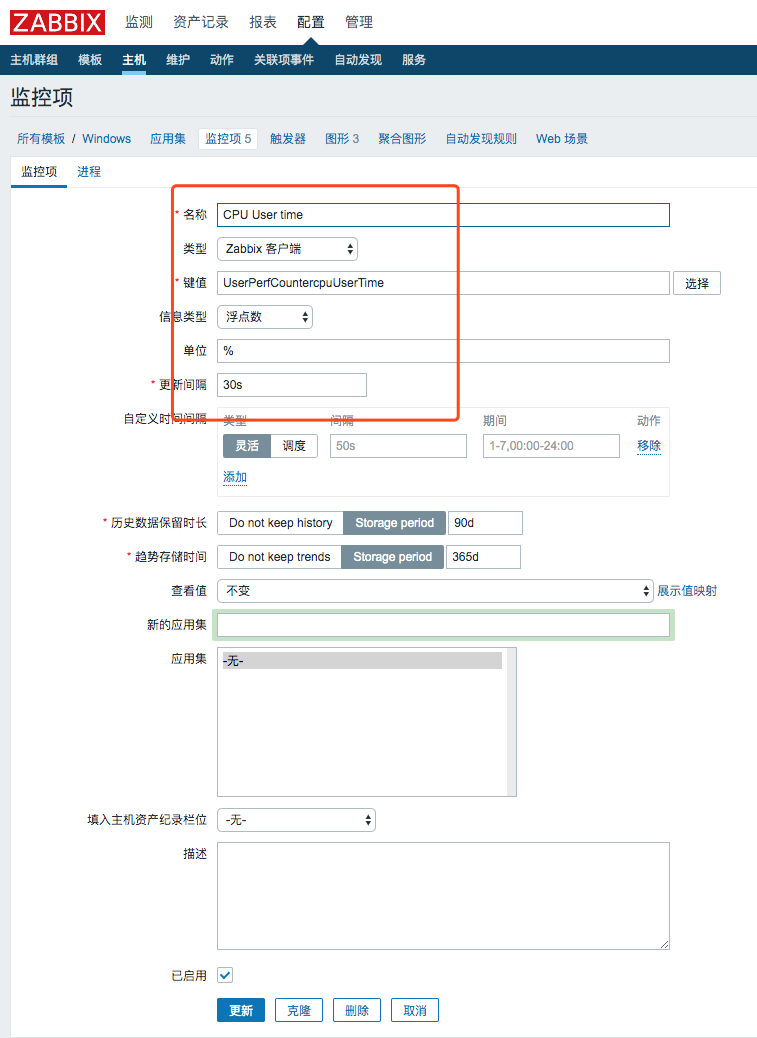
以此类推新建剩余的几个
-
监控项
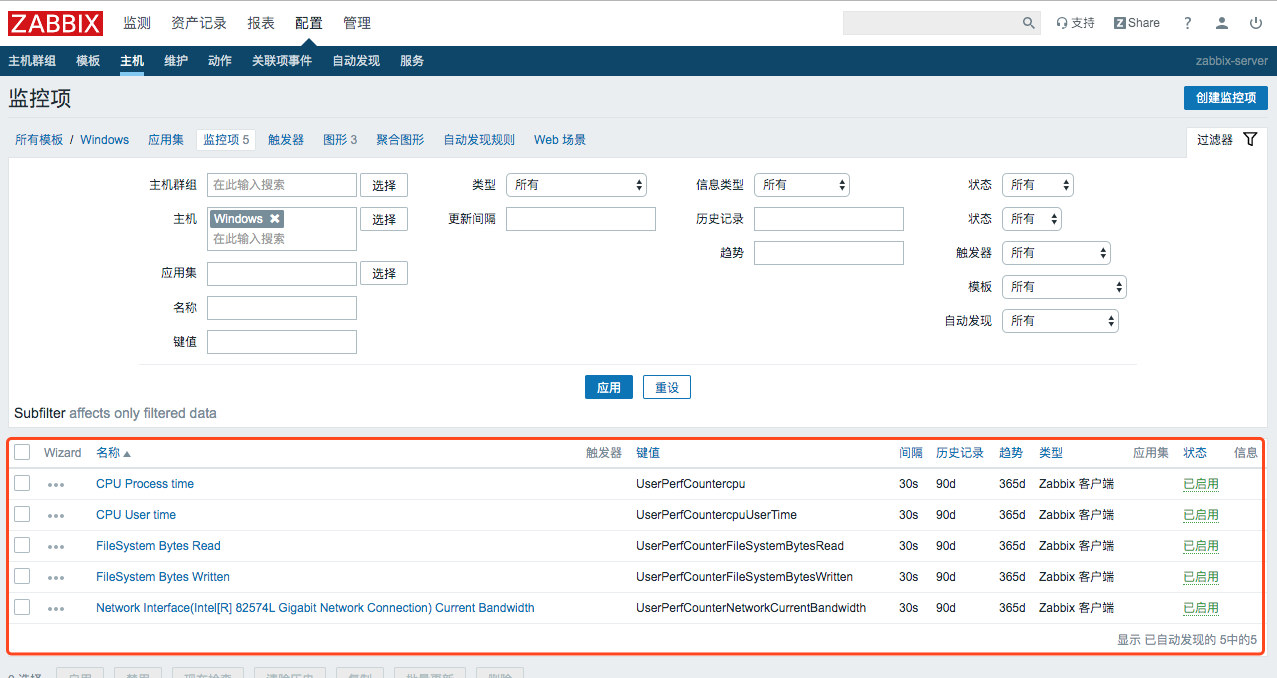
-
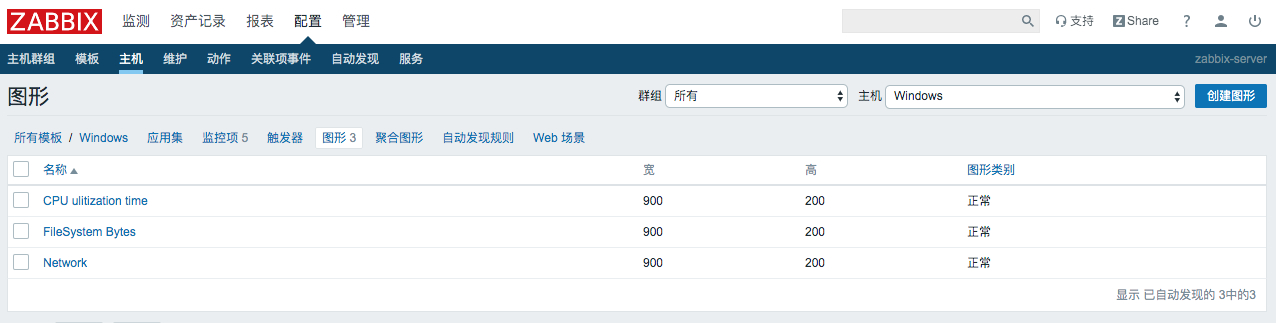
图形
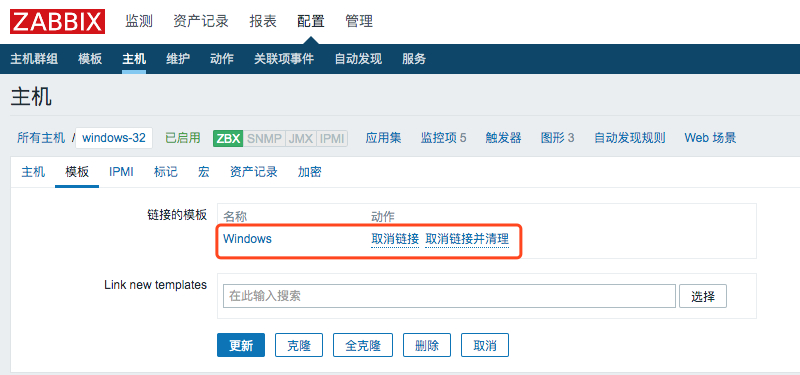
给主机添加模板
5. 效果


6. 参考
zabbix监控windows服务器
Zabbix 4.4 监控 Windows Server 2016
“The first 90% of the code accounts for the first 90% of the development time. The remaining 10% of the code accounts for the other 90% of the development time.” – Tom Cargill
标 题:zabbix 4.4.7 监控Windows作 者:Leif160519
出 处:https://github.icu/articles/2020/04/16/1587034446292.html
关于博主:坐标六朝古都南京,服务器运维工程师+桌面运维工程师,如有问题探讨可以直接下方留言。
声援博主:如果您觉得文章对您有帮助,可以评论、订阅、收藏。您的鼓励是博主的最大动力!