 Leif160519的blog
——————
目录
Grafana获取Zabbix数据
Grafana获取Zabbix数据

1.安装Grafana
1.1 下载安装包
官网下载地址
wget https://dl.grafana.com/oss/release/grafana-6.7.3-1.x86_64.rpm
sudo yum install grafana-6.7.3-1.x86_64.rpm
1.2 启动Grafana
启动Grafana服务并设置开机自启
systemctl start grafana-server
systemctl enable grafana-server
1.3 访问Grafana
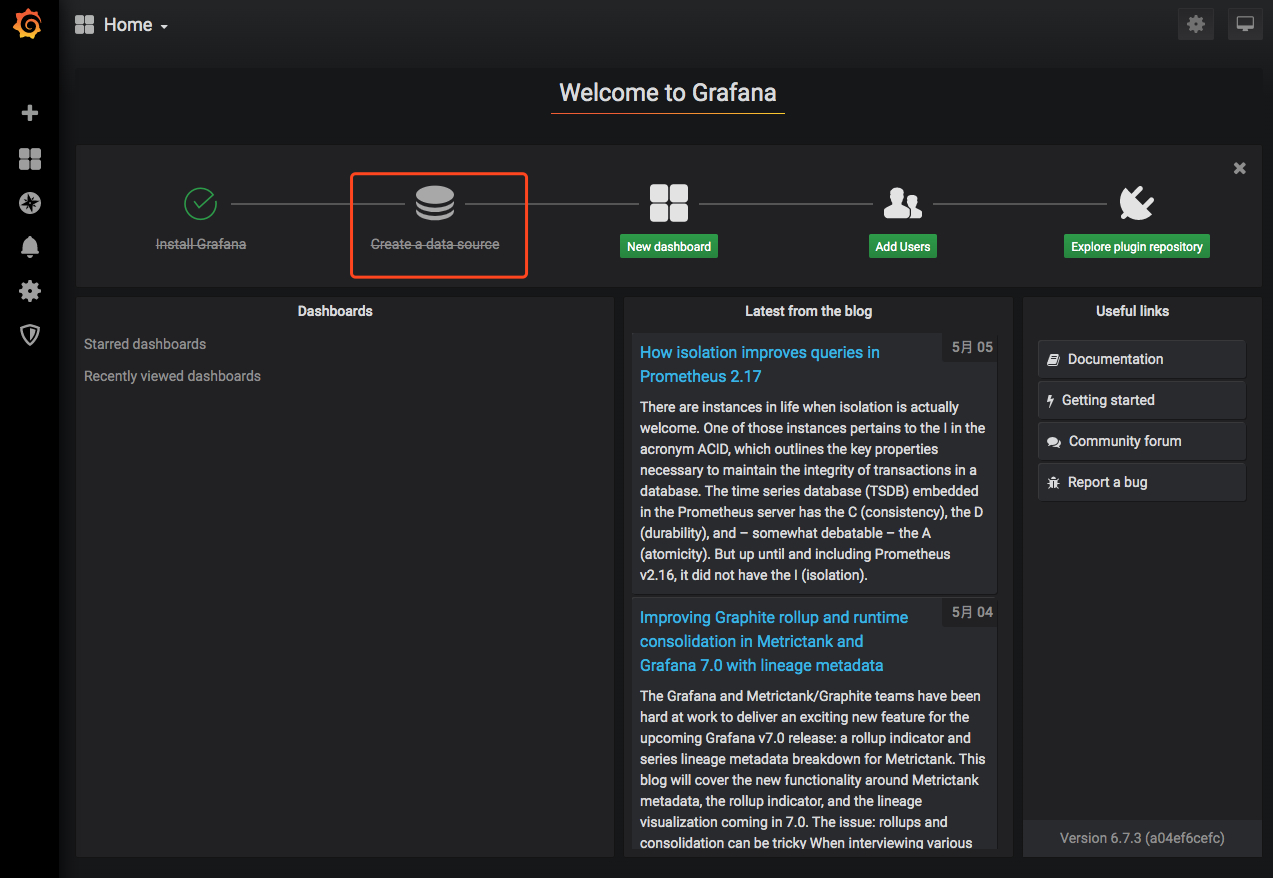
访问地址:http://192.168.4.222:3000 用户名:admin 密码:admin 输入过后会提示设置一个新密码

2.添加zabbix数据源
登录进去之后点击添加数据源
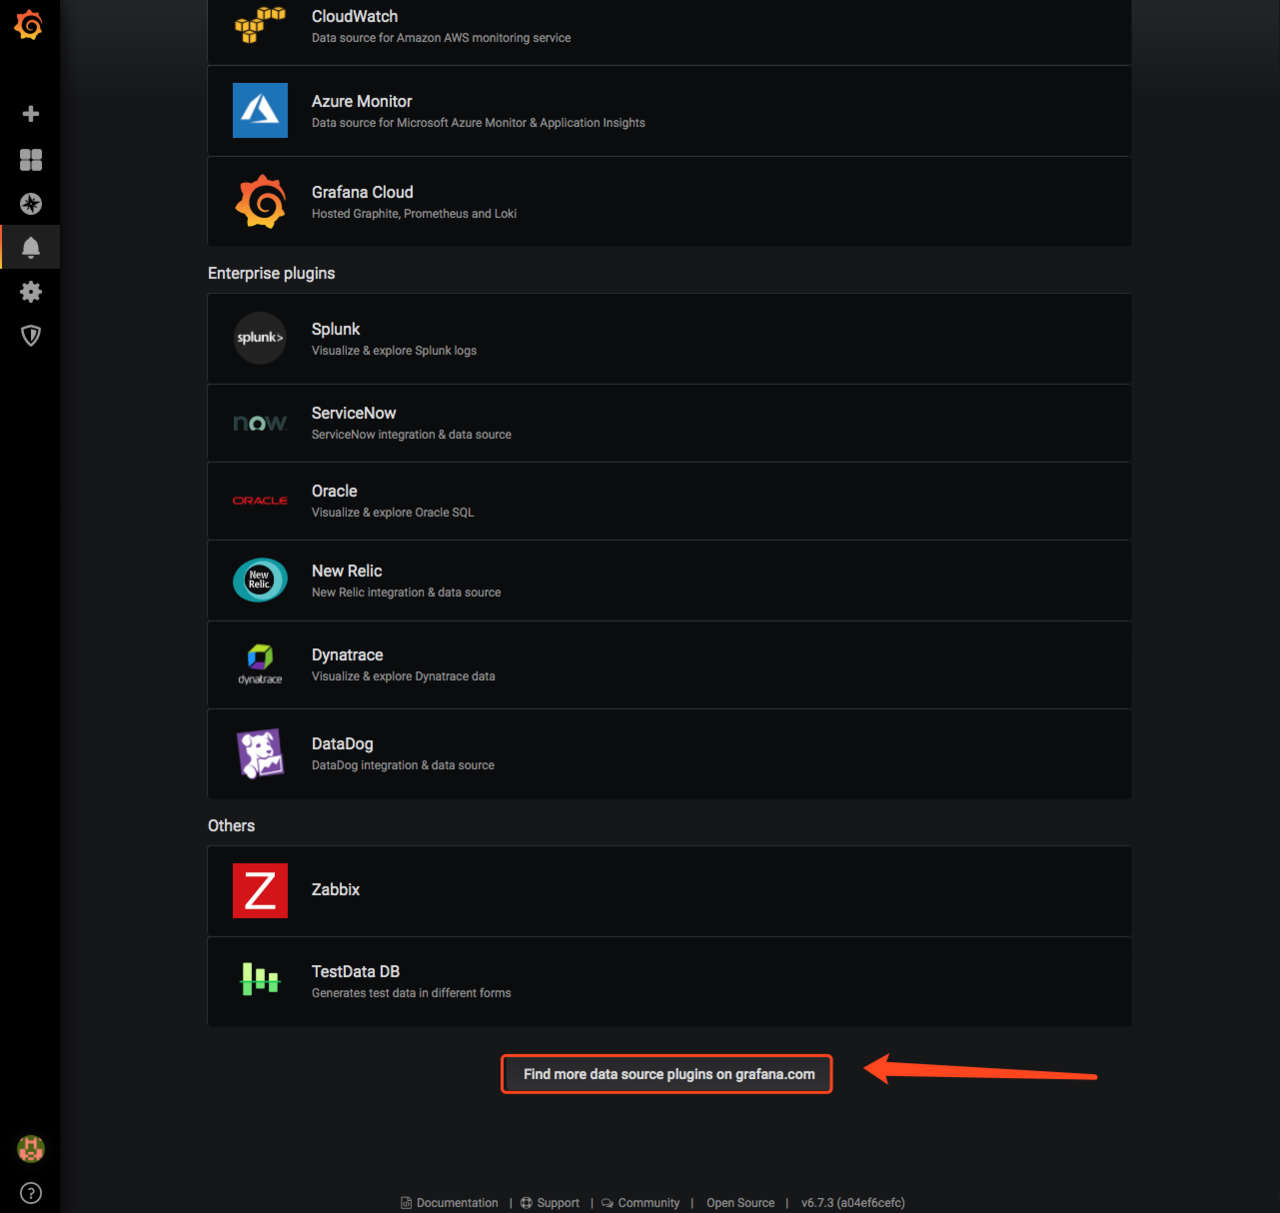
发现列表里面并没有zabbix数据源,故我们需要安装一下:
点击最下方Find more data source plugins on grafana.com
点击zabbix
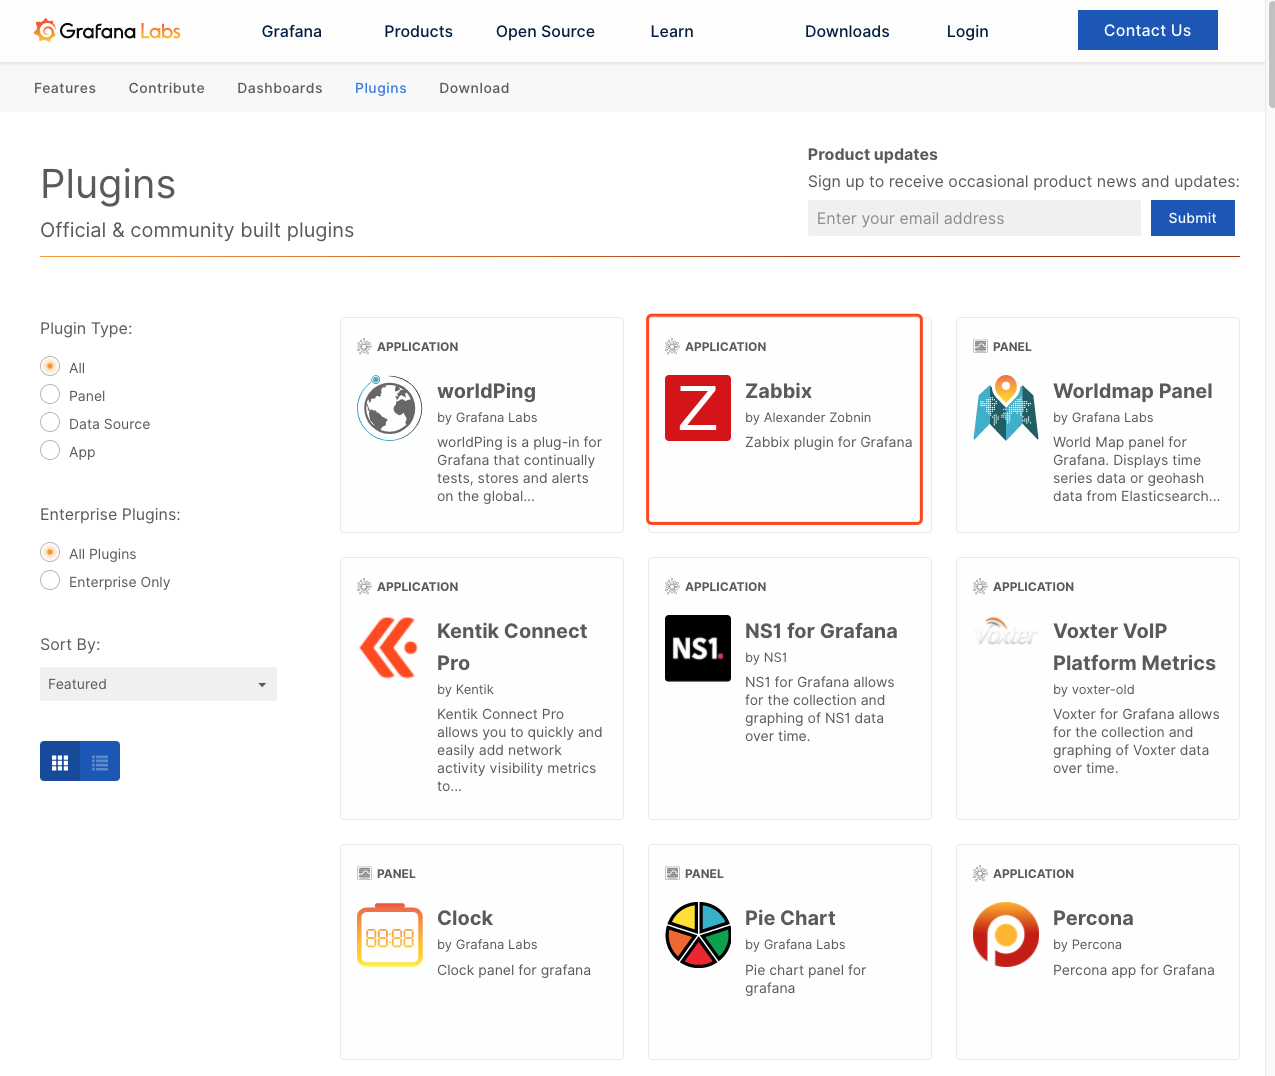
1.使用下列命令安装zabbix数据源
grafana-cli plugins install alexanderzobnin-zabbix-app
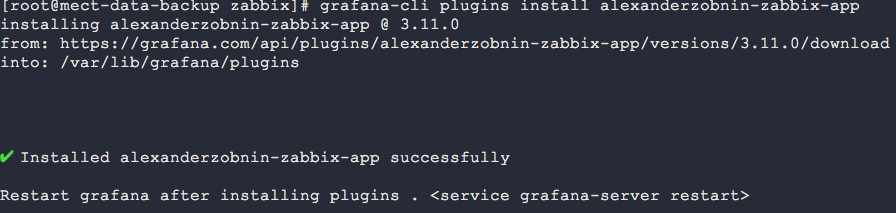
2.安装完毕之后按照提示重启Grafana服务
service grafana-server restart
Restarting grafana-server (via systemctl):                 [  确定  ]
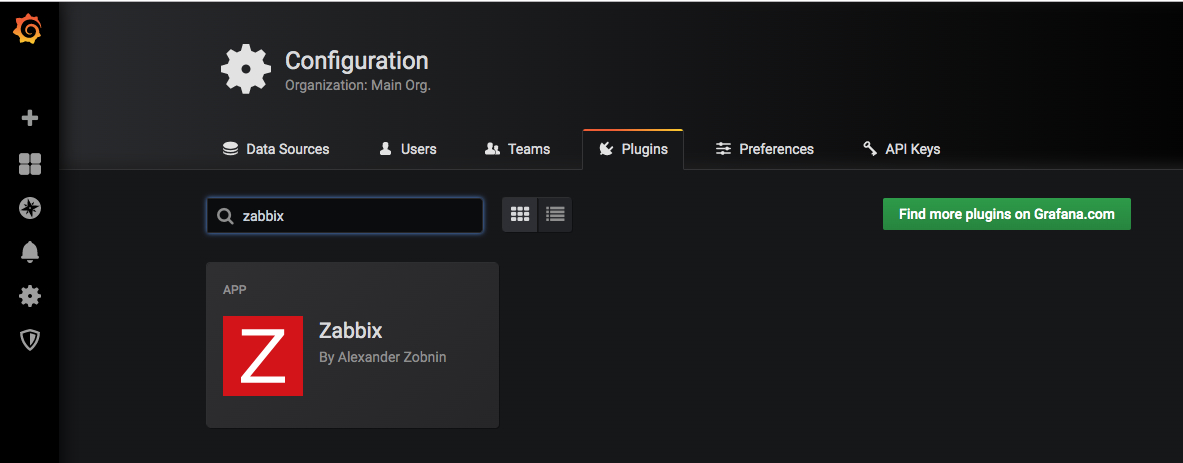
3.去plugin中查找zabbix数据源:
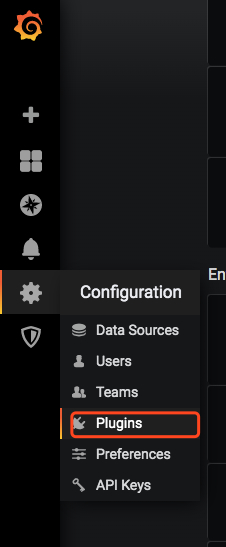
4.搜索zabbix,点击进去并启动它(默认是禁用的):
3.配置zabbix数据源
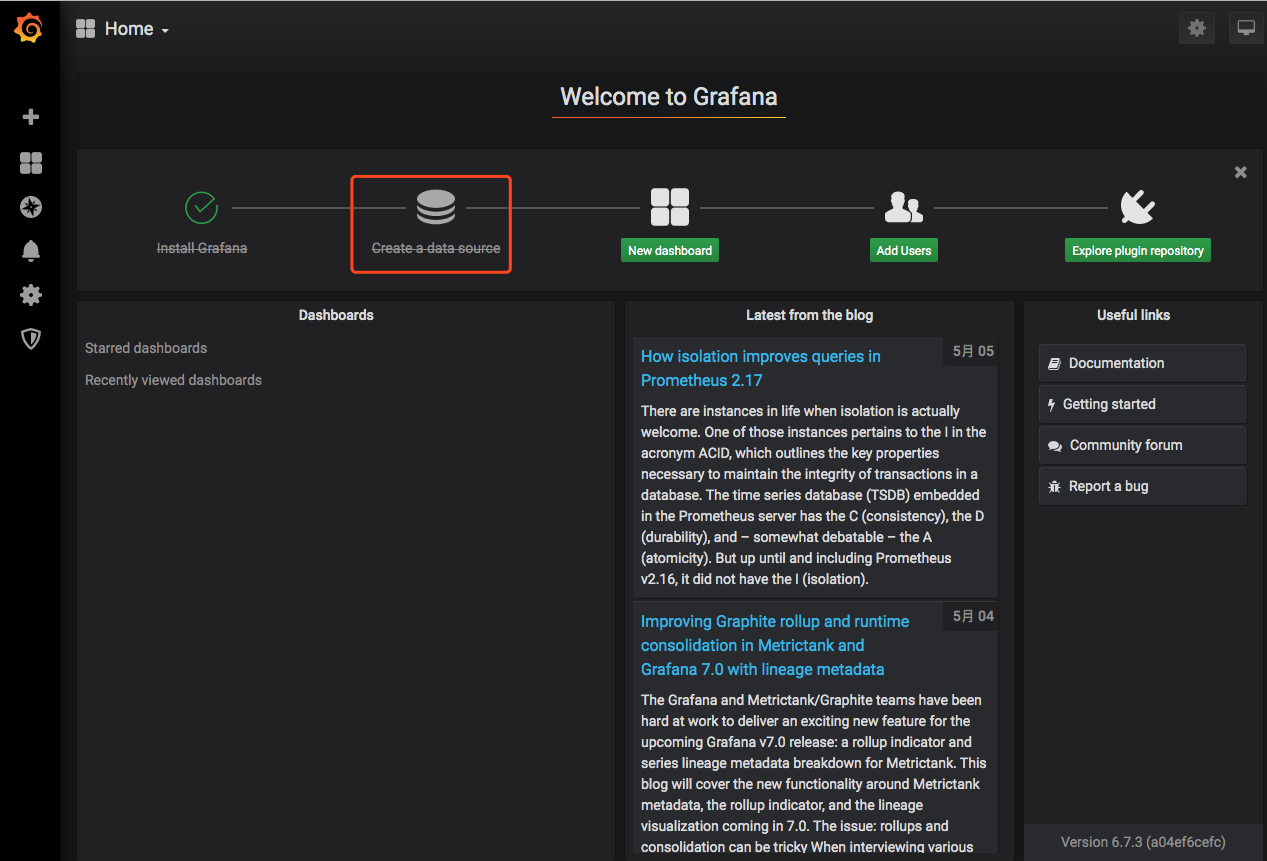
1.创建一个数据源Create a data source
2.选择zabbix
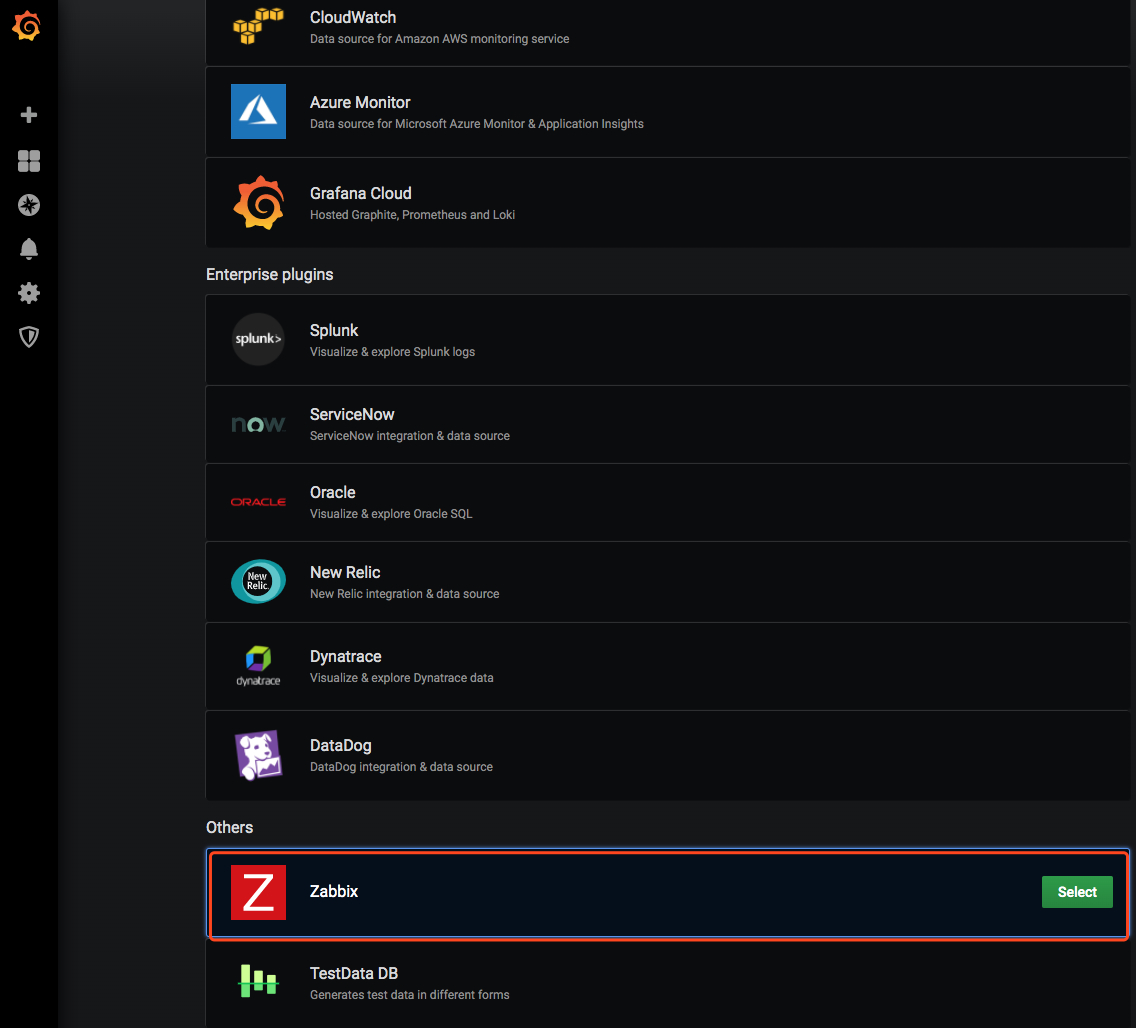
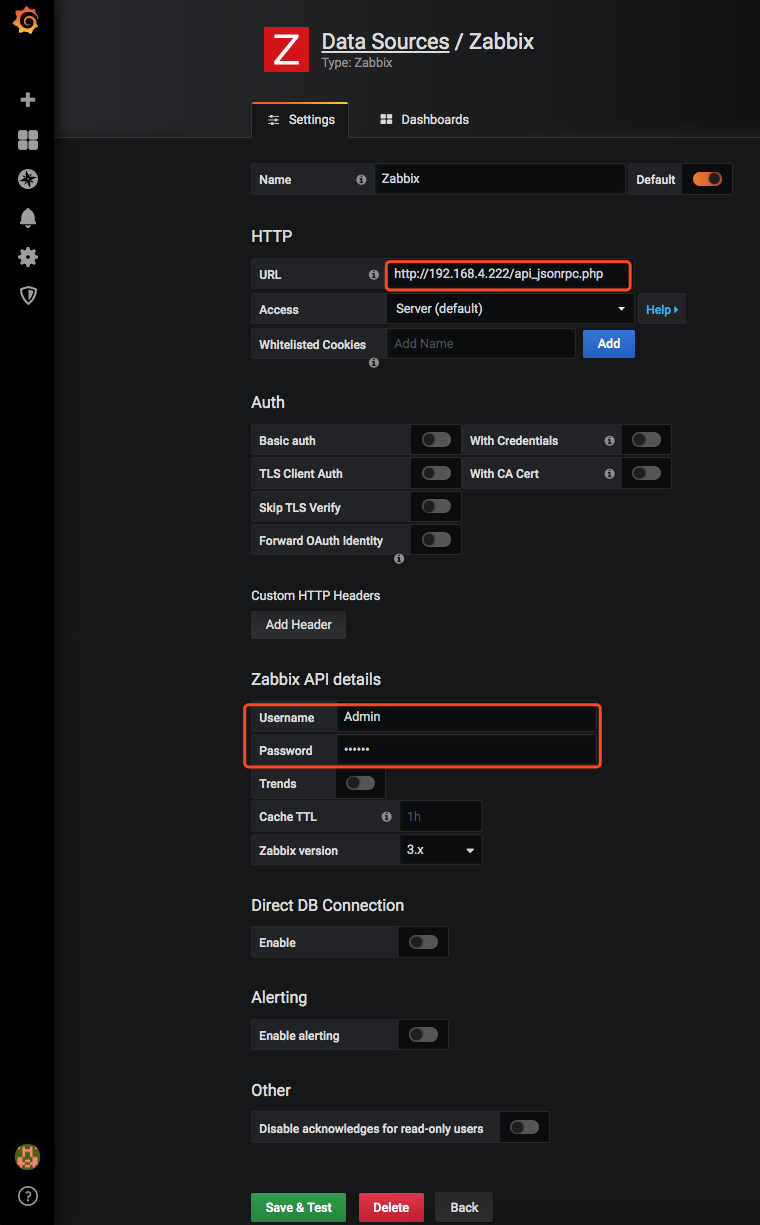
3.输入zabbix的API地址(http://192.168.4.222/api_jsonrpc.php)和登录zabbix的用户名和密码,最后点击Save & Test测试和保存
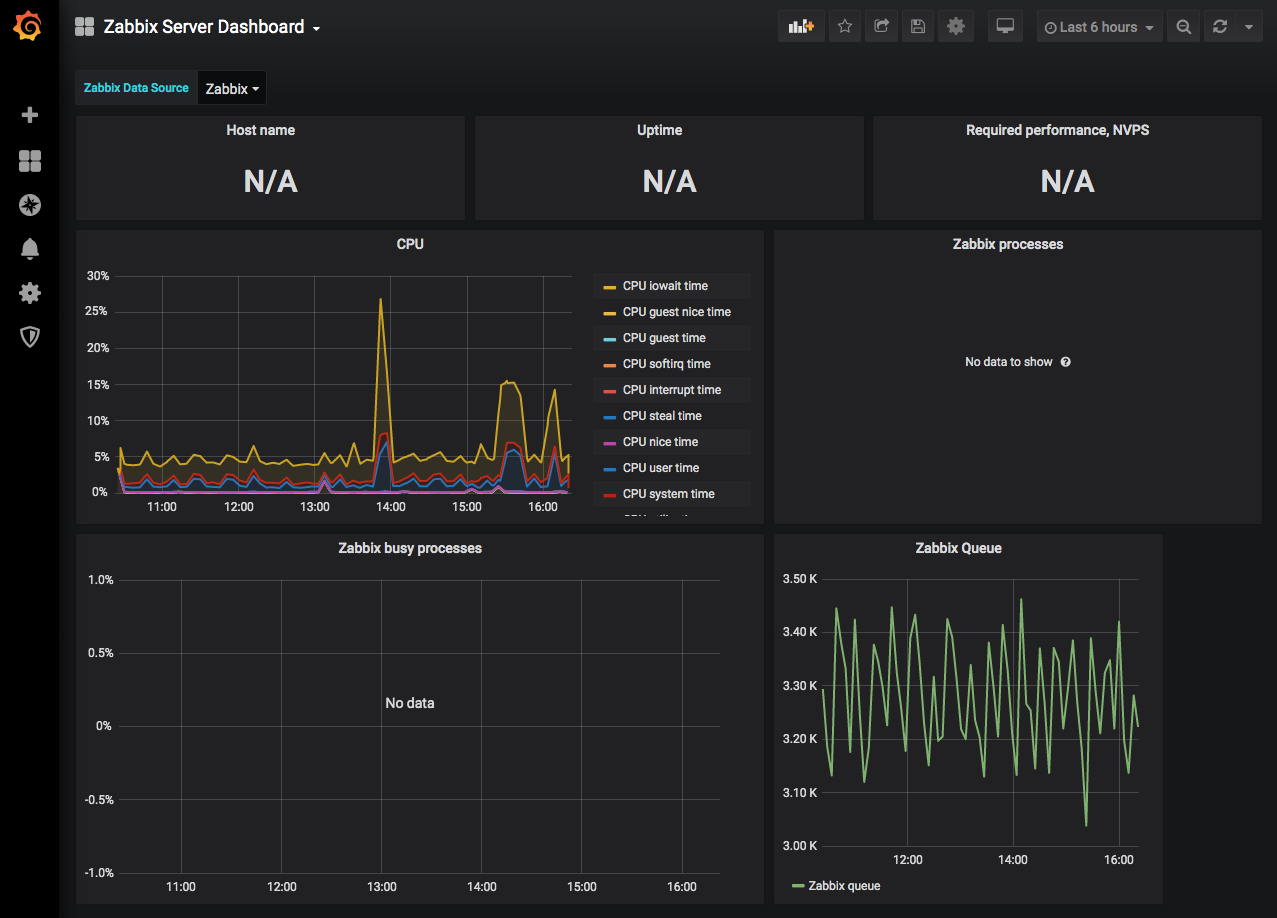
4. 添加zabbix仪表盘:
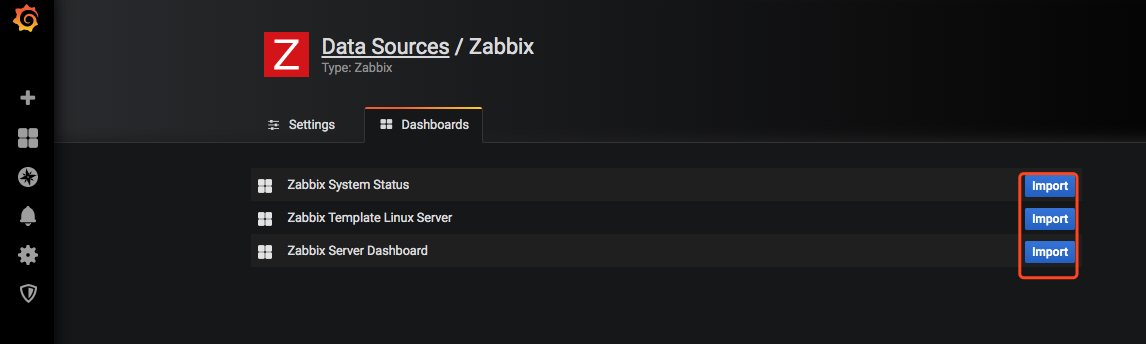
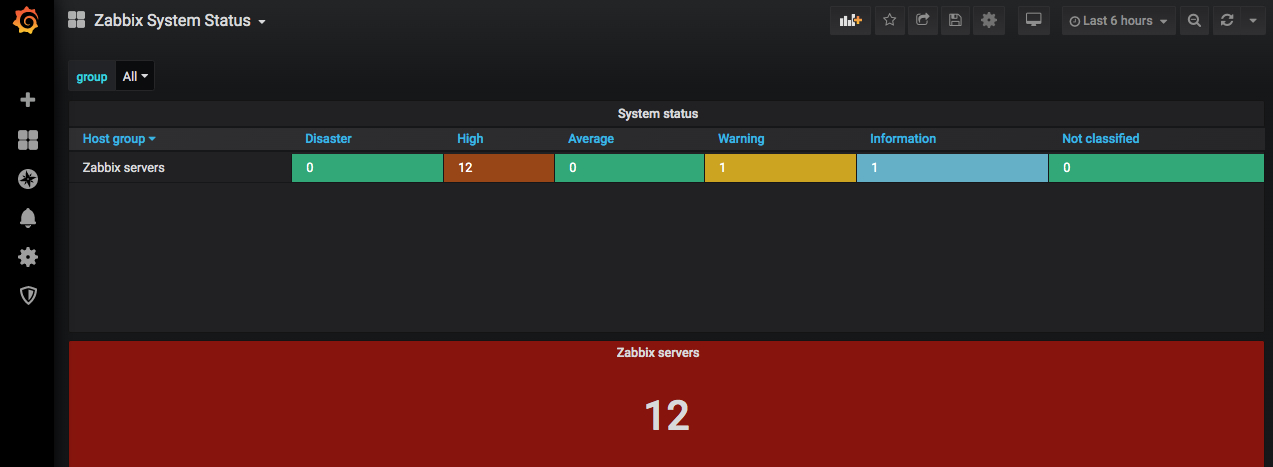
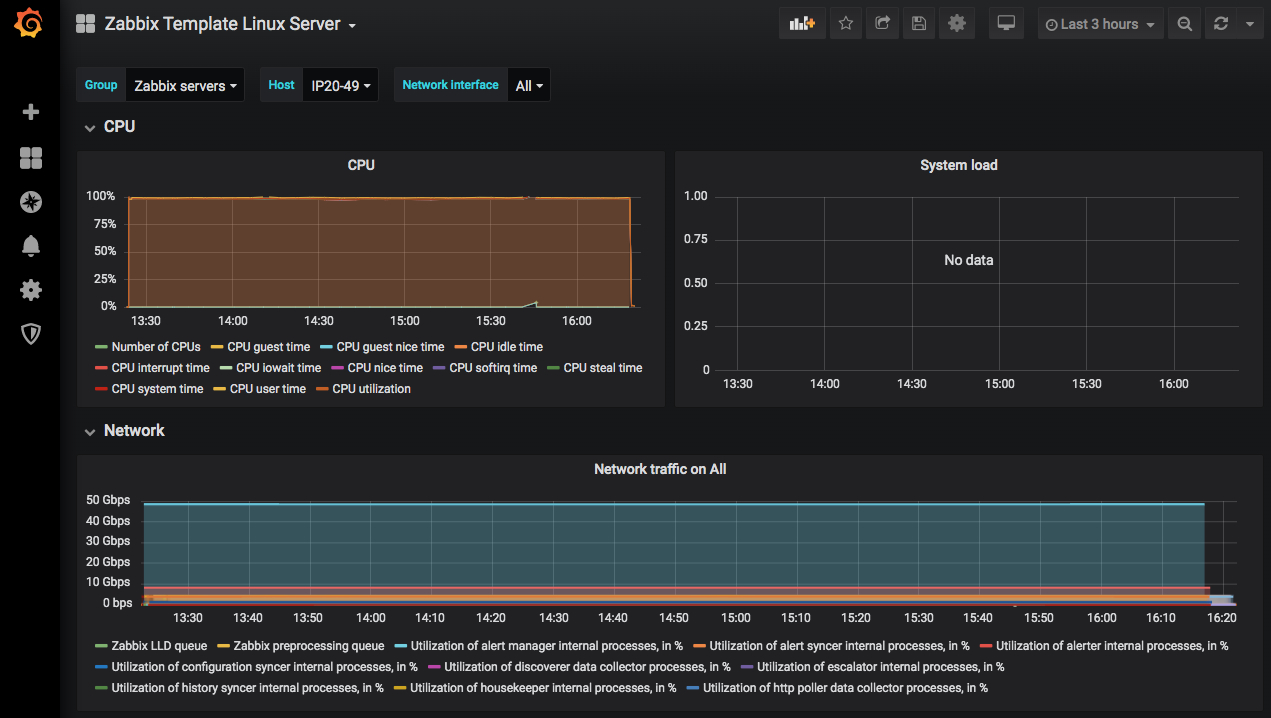
全部添加过后可以点击进去查看
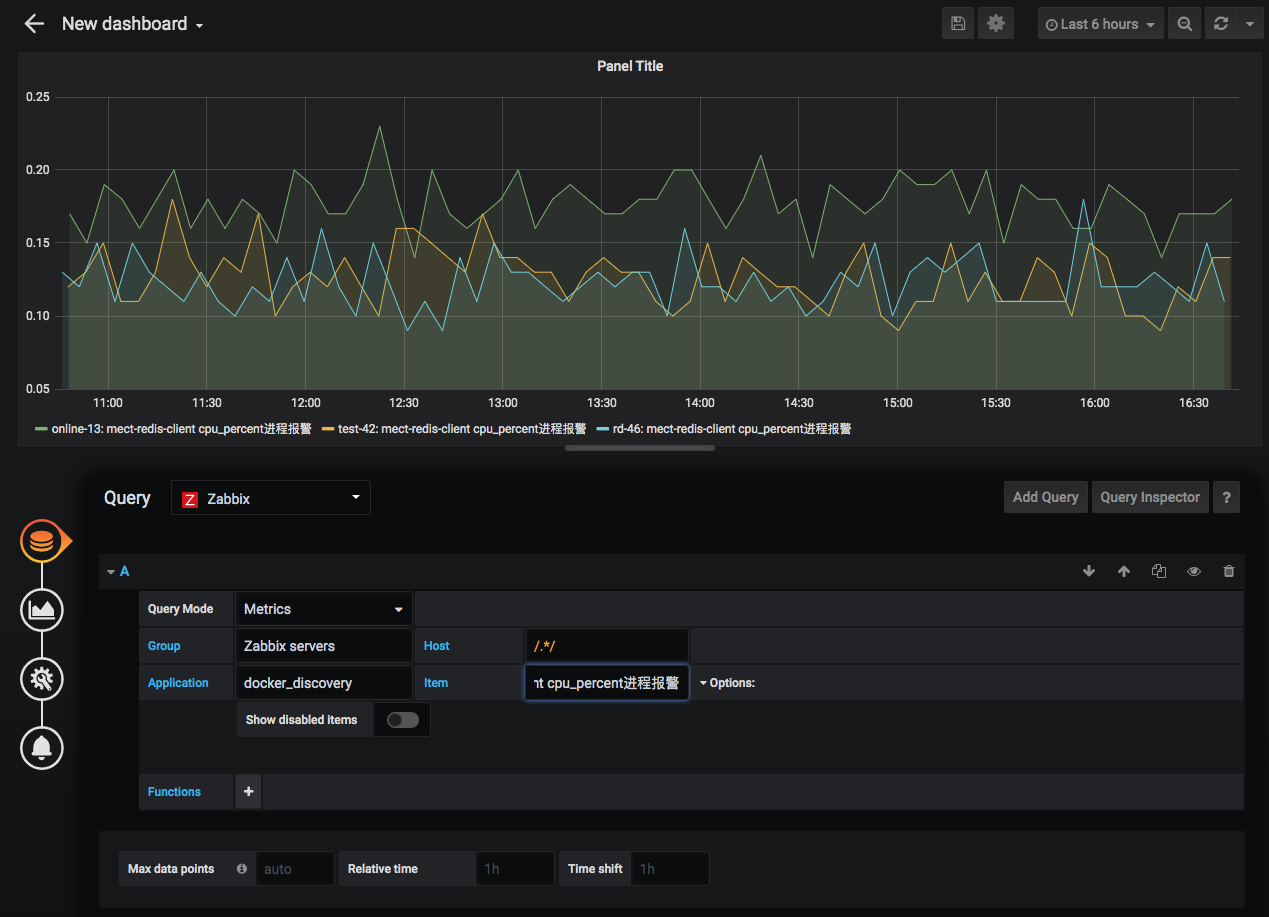
5.自定义仪表盘
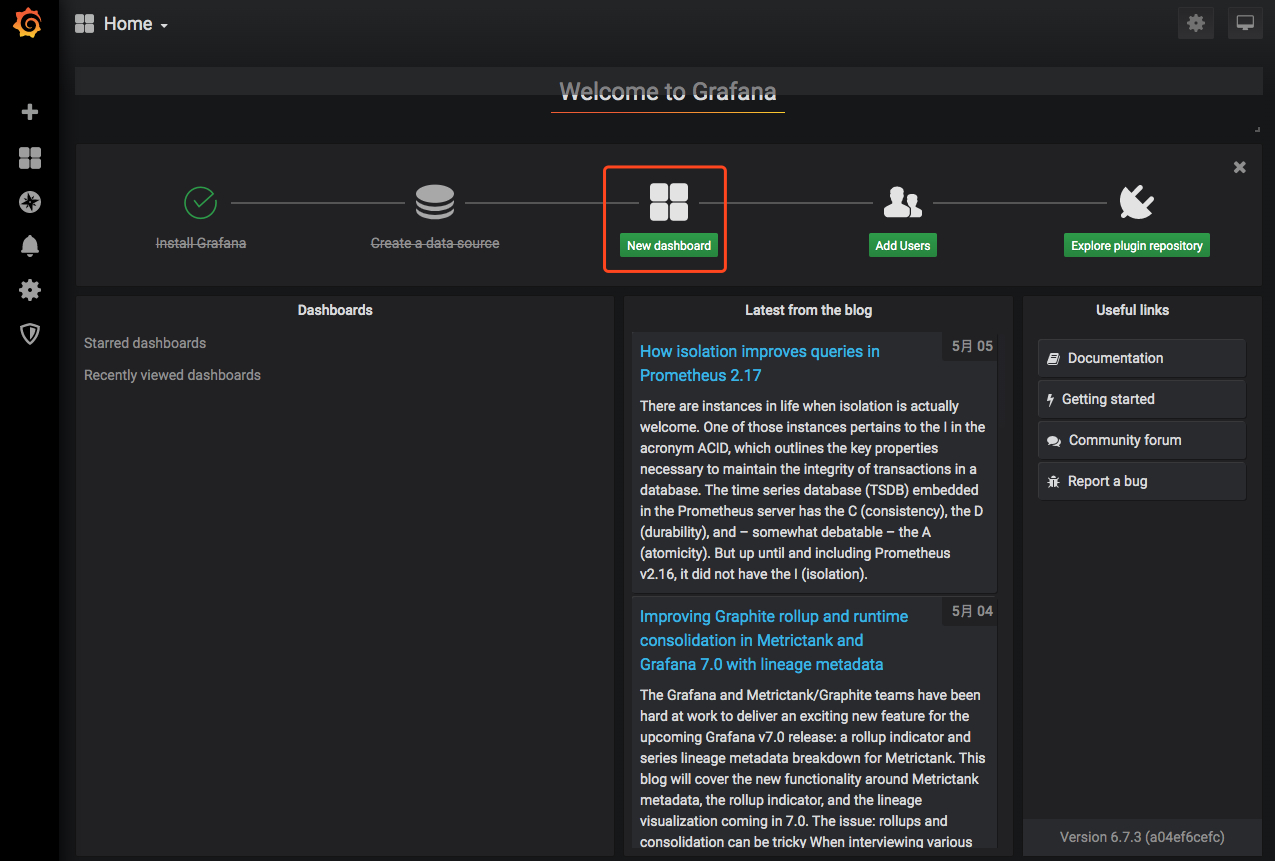
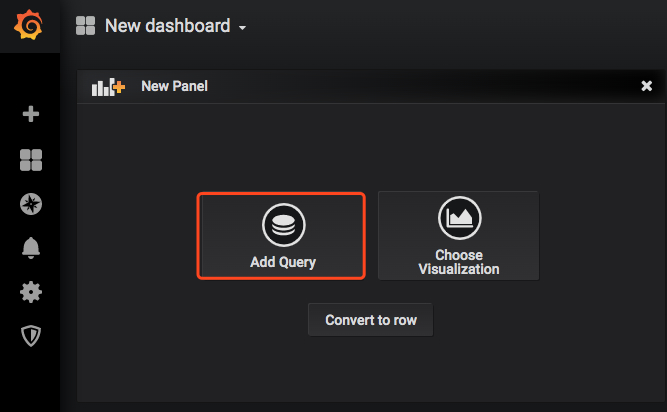
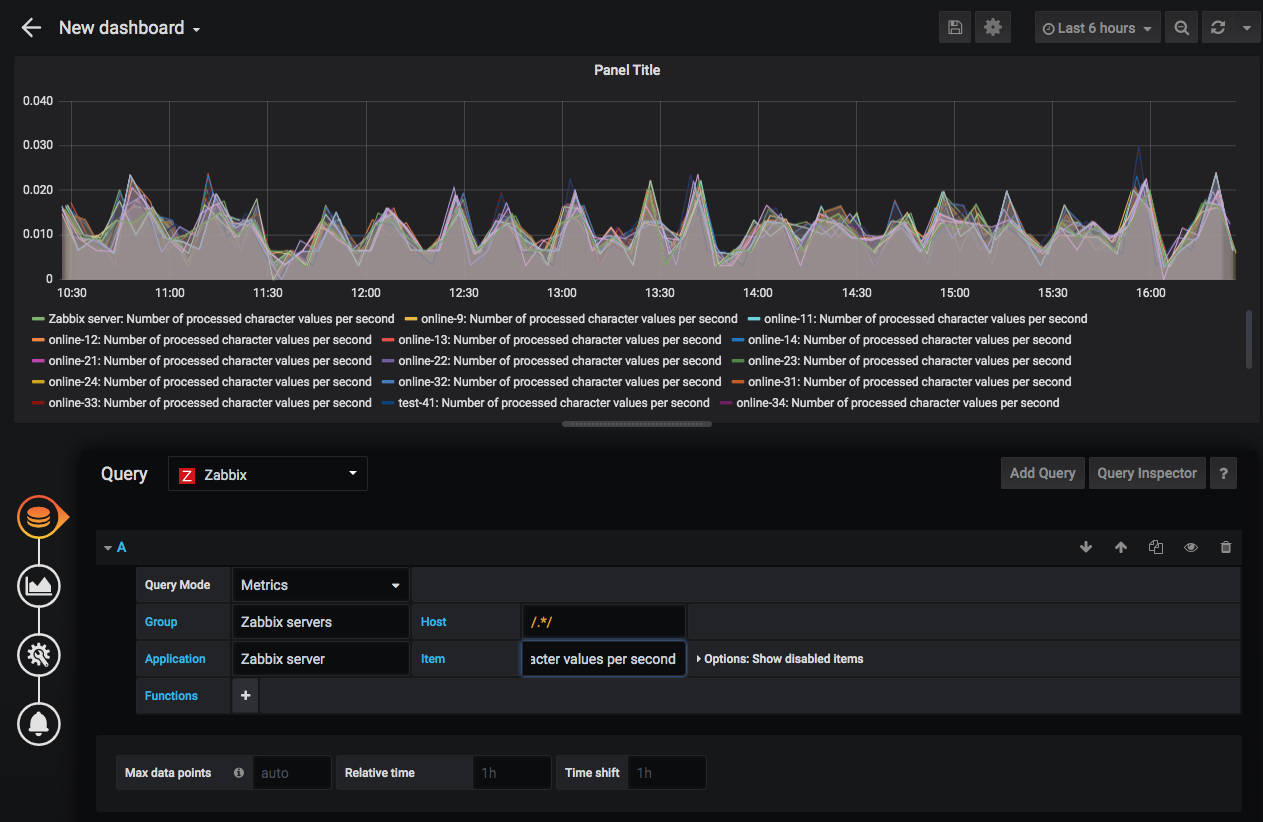
当然你也可以创建自定义仪表盘
点击创建新的仪表盘New dashboard:
参考
“The first 90% of the code accounts for the first 90% of the development time. The remaining 10% of the code accounts for the other 90% of the development time.” – Tom Cargill
标 题:Grafana获取Zabbix数据作 者:Leif160519
出 处:https://github.icu/articles/2020/05/06/1588754730077.html
关于博主:坐标六朝古都南京,服务器运维工程师+桌面运维工程师,如有问题探讨可以直接下方留言。
声援博主:如果您觉得文章对您有帮助,可以评论、订阅、收藏。您的鼓励是博主的最大动力!